Events & Alarms
Overview
TEKTELIC KONA Core Network Server records an event each time something notable happens to a gateway, a device or an integration in your LoRaWAN® network. Some events report a problem that lasts, such as a device that stops sending data. These alarms stay raised until the problem ends. Knowing the difference tells you which records need action, how long they stay open and how to get notified.
How it works
Events and alarms
In KONA Core, every record on the Alarms page is an event. Each event has a type, shown in the Type column and in the Event types filter:
| Type | What it records |
|---|---|
| Alarms | A problem condition, for example one reported by a gateway. |
| Faults | A fault condition, for example one reported by a gateway. |
| Offline | A lost connection or a missing report, for example a device that exceeds its reporting interval, or an integration that is disconnected. |
| Events | An occurrence such as a processing failure or the first successful uplink after an integration connects. |
confirm the exact meaning of each event type and which event names belong to Alarms and to Faults.
Read the Type and State together. Records of type Events can also have Raised and Clear states. For example, converter failures can raise an event, while INTEGRATION_FIRST_UL records a successful uplink with Clear.
Every event also has:
- Entity: the source of the event: Gateway, Device or Integration.
- Label: the name or ID of that gateway, device or integration.
- Event name: a fixed code, for example
DEVICE_DATA_REPORTING_INTERVAL_EXCEEDED. For every event name, with its meaning and what to do, see Alarms & Events Reference. - Severity: Critical, Major or Minor.
- Description and Description details: what happened, sometimes with the cause and the payload involved.
- State: Raised or Clear.
KONA Core records events and raises alarms without any alarm rule, for example in an application that has no rules. Alarm rules only decide who gets notified: see Forward events and alarms.
Severities
Each event name has a fixed severity. Users can't change it, and an alarm rule doesn't set it. In a gateway group rule, the Gateway alarm and Gateway fault triggers have a Severity filter: it decides which events send a notification.
| Severity | How to treat it |
|---|---|
| Critical | Act now. Data is likely not reaching your system, for example when an integration is disconnected. |
| Major | Act soon. A gateway, device or integration doesn't work as expected, for example a device that stops reporting. |
| Minor | Check when convenient, for example the first successful uplink after an integration connects. |
The severity of each event name is listed in Alarms & Events Reference.
Alarm lifecycle
KONA Core records an alarm's lifecycle with two states:
- Raised: KONA Core detects the condition, for example a device that doesn't send data within its reporting interval. The alarm appears on the Alarms page with the state Raised and its Start time.
- Clear: the condition ends, for example the device sends data again. KONA Core adds a new record with the state Clear rather than changing the earlier Raised record.
KONA Core creates a new Raised record as soon as a new qualifying occurrence is detected. One entity can therefore have several records with the same event name. For inactivity conditions, detection happens when the configured timeout expires.
KONA Core records Clear when the condition ends. You can't acknowledge or clear alarms by hand. Neither the UI nor the API provides those actions.
Inactivity alarms depend on the timeout you set on the entity. KONA Core raises the alarm as soon as that interval passes without data:
| Entity | Default inactivity timeout |
|---|---|
| Gateway | 300 seconds (5 minutes) |
| Device | 3600 seconds (1 hour) |
For example, a gateway with a 5-minute inactivity timeout raises an inactivity alarm after 5 minutes without transmitting data.
Gateways send statistics every 30 seconds. For MQTT, Online indicates that the connection responds to keep-alive pings. For UDP, Online tracks statistics reports; if they stop, the gateway becomes Offline after Offline timeout (sec). The offline timeout defaults to 300 seconds (5 minutes). See Monitor Gateways.
A gateway that stops reporting data raises GATEWAY_DATA_REPORTING_INTERVAL_EXCEEDED. A lost MQTT connection raises GATEWAY_MQTT_CONNECTION_LOST. The MQTT connection event doesn't apply to UDP gateways. See Alarms & Events Reference.
Where you see events and alarms
| Where | What you see |
|---|---|
| Alarms in the side menu | The events of all your gateways, devices and integrations. With Raised only selected (the default), the list shows only raised alarms. Clear Raised only to see the history, including cleared alarms and events of the type Events. The default time window is LAST DAY. |
| A gateway's Events tab | The events of that gateway, with the same filters. The tab opens with the type Alarms and Raised only selected. See Monitor Gateways. |
| A device's Real-time packets tab | The device's uplinks and downlinks as they arrive. These are packets, not events. Device events appear on the Alarms page, with Entity set to Device. See Device Activity & Status. |
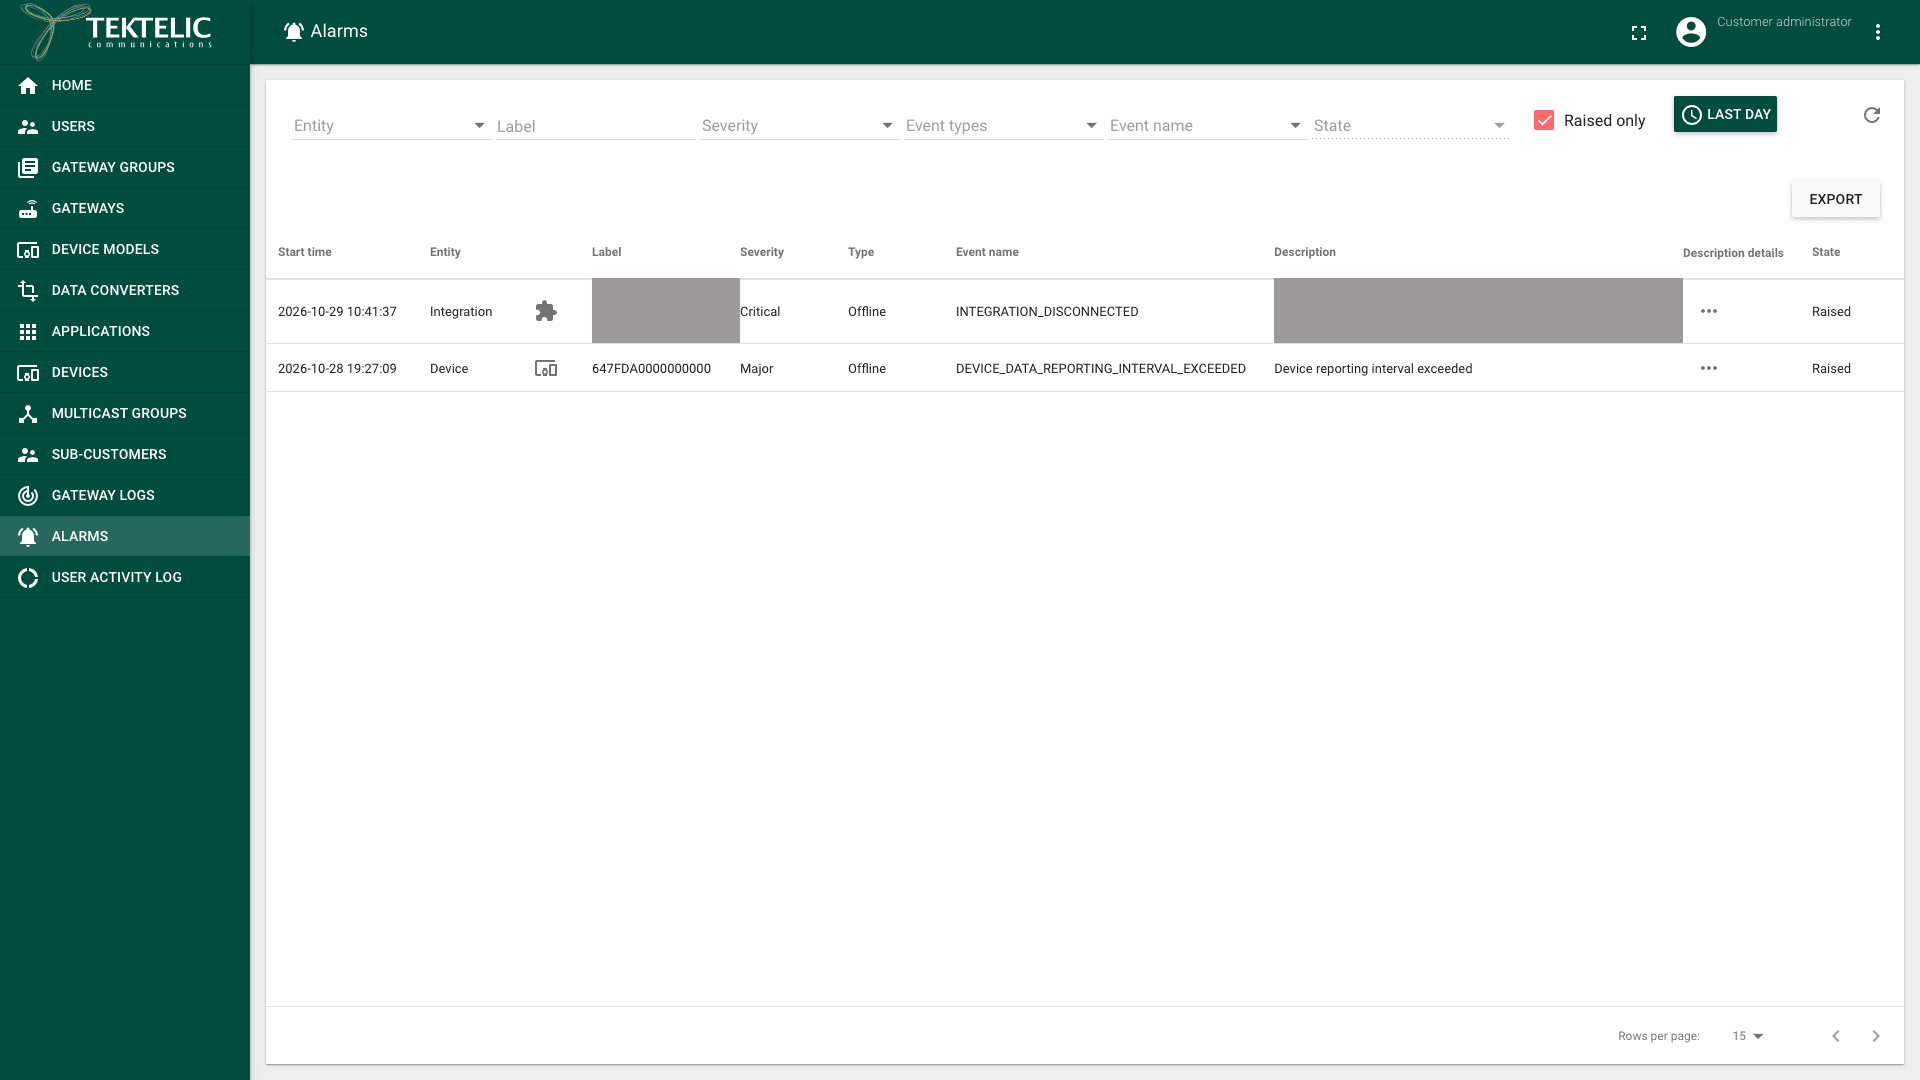
On the Alarms page you filter by Entity, Label, Severity, Event types, Event name and State. EXPORT saves the list as a CSV file. To filter, read details and export, see Work with Alarms.
All roles except System roles can open Alarms. You see only events for entities within your permissions. You don't see alarms for inaccessible entities, higher-level tenants or unrelated tenants.
Forward events and alarms
To get notified, add an alarm rule. You set alarm rules on the Alarm Rules tab of an application or a gateway group. A rule has:
- Alarm triggers: the conditions that start a notification. Most triggers come in pairs, one for raise and one for clear, for example Device is offline and Device is online. Add both to know when a problem starts and when it ends.
- Notifications: where the notification goes. The types are Email, SMS and MQTT. An email notification has a Subject and a Body, with references such as
$eventSeverityand$eventStatethat KONA Core replaces with the event's values.
Application rules cover the devices, integrations and data converters of the application. Gateway group rules cover the gateways of the group, including the triggers Gateway alarm and Gateway fault for alarms that the gateway reports. For the steps and the full list of triggers, see:
- Configure Application Alarm Rules
- Configure Gateway Group Alarm Rules
- Alarm Notifications, for recipients and channels
- Events over MQTT, to receive events in your own system
We recommend an email notification for every Critical trigger of your applications and gateway groups, for example Integration is disconnected and Gateway lost MQTT connection. A Critical event usually means that data doesn't reach your system.
To read events from your own system, use Get raised enhanced events for raised alarms and Get all enhanced events for the history.