Integration Monitoring
Overview
Find out whether an integration delivers the data of your LoRaWAN® devices, and why it doesn't when it fails. TEKTELIC KONA Core Network Server reports an integration's state as events and alarms. It counts deliveries, retries and downlinks per integration, and runs of the data converter. You read these in the UI, get notified by an alarm rule, and fix the cause.
This guide covers the V2 integrations HTTP_V2, MQTT_V2 and MQTT_BROKER. To set one up, see HTTP Integration, MQTT Integration or MQTT Broker Integration.
Before you start
- Role: to read integration statistics, any Customer or Sub-Customer role. A Provider has no top-level integrations page. See Users, Roles & Permissions.
- Alarms page: all roles except System roles. You see an integration's alarms only if your permissions include that integration. See Alarm Notifications.
- Data converters page: Customer administrator, Customer user or Sub-Customer administrator. The UI doesn't offer this page to a Sub-Customer user.
- Integration: an integration of the type HTTP_V2, MQTT_V2 or MQTT_BROKER. The integrations page shows the statistics icons for these types and for the legacy HTTP.
Steps
Check the integration's status
The integrations page has no status column. An integration's status comes from its events: KONA Core raises an alarm when the integration can't deliver, and clears it when delivery works again.
- In the side menu, select Alarms. The Alarms page opens with Raised only selected.
- In Entity, select Integration.
- In Label, enter the name of the integration. The list shows the integration's raised alarms. If the list is empty, the integration has no open problem.
- To see the history, clear Raised only. The list now also shows cleared alarms and informational events, such as
INTEGRATION_FIRST_UL. - To read an alarm's full text, select the … (more) icon in Description details in its row. The Description details dialog opens. The description is the error log of the integration: it names the cause, and often the payload involved.
- Select Close.
For the Alarms page in detail, see Work with Alarms.
Alarms page filtered by Entity Integration, with a raised INTEGRATION_DISCONNECTED alarm. The live alarm shows a real endpoint address in its description, which must be masked.
The events that concern integrations:
| Event | What it tells you |
|---|---|
INTEGRATION_DISCONNECTED | Offline, Critical. The integration can't deliver data to your system. For HTTP_V2, the description gives the request address and the cause, for example with Cause: [404 NOT_FOUND], or . The alarm clears when delivery works again. |
INTEGRATION_FIRST_UL | Event, Minor. The first successful uplink after the integration connects: Data flows again. |
INTEGRATION_UL_DECODING_FAILURE | The data converter failed to decode an uplink. |
INTEGRATION_DL_ENCODING_FAILURE | The data converter failed to encode a downlink. |
DECODER_BANNED, ENCODER_BANNED | KONA Core stopped running the decoder or the encoder of the data converter for a while. See Check the data converter. |
For every event, its type and severity, see Alarms & Events Reference.
Read the delivery statistics
-
In the side menu, select Applications.
-
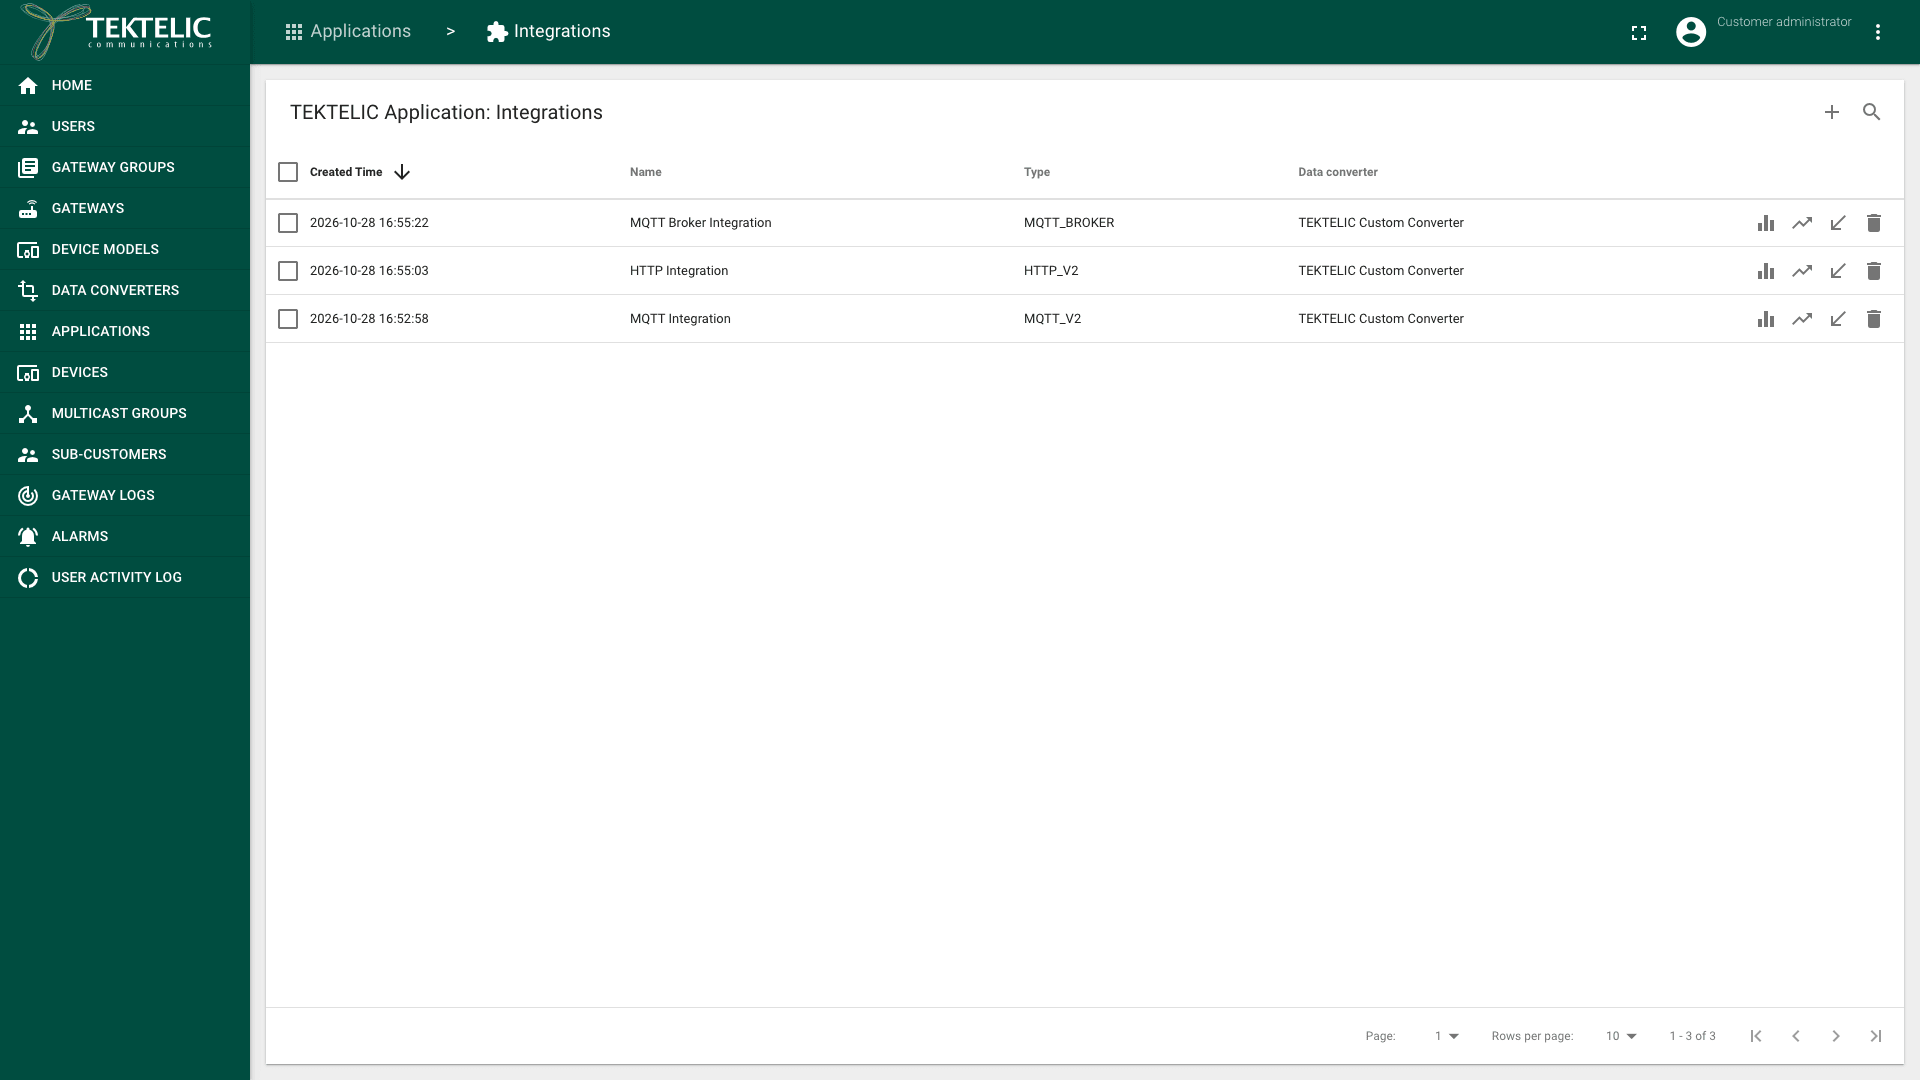
In your application's row, select Manage integrations. The integrations page lists the application's integrations. Each row has the icons Show retry statistics, Show UL delivery statistics and Show DL statistics. The same actions are buttons in the integration's details panel.
-
Select Show UL delivery statistics (the trend icon). The Integration UL Delivery Statistics dialog opens. Each row has a Time window, a Metric and a Count:
- Delivered: uplinks the integration delivered to your system in that window.
- Dropped: uplinks the integration didn't deliver. When the last retry of the Retry scheme fails, KONA Core drops the uplink and increases Dropped by one.
The dialog shows no rows when the integration had no uplinks to deliver.
Integration UL Delivery Statistics dialog with Delivered and Dropped rows. The integrations of the test account had no delivery data.
-
Select Close.
-
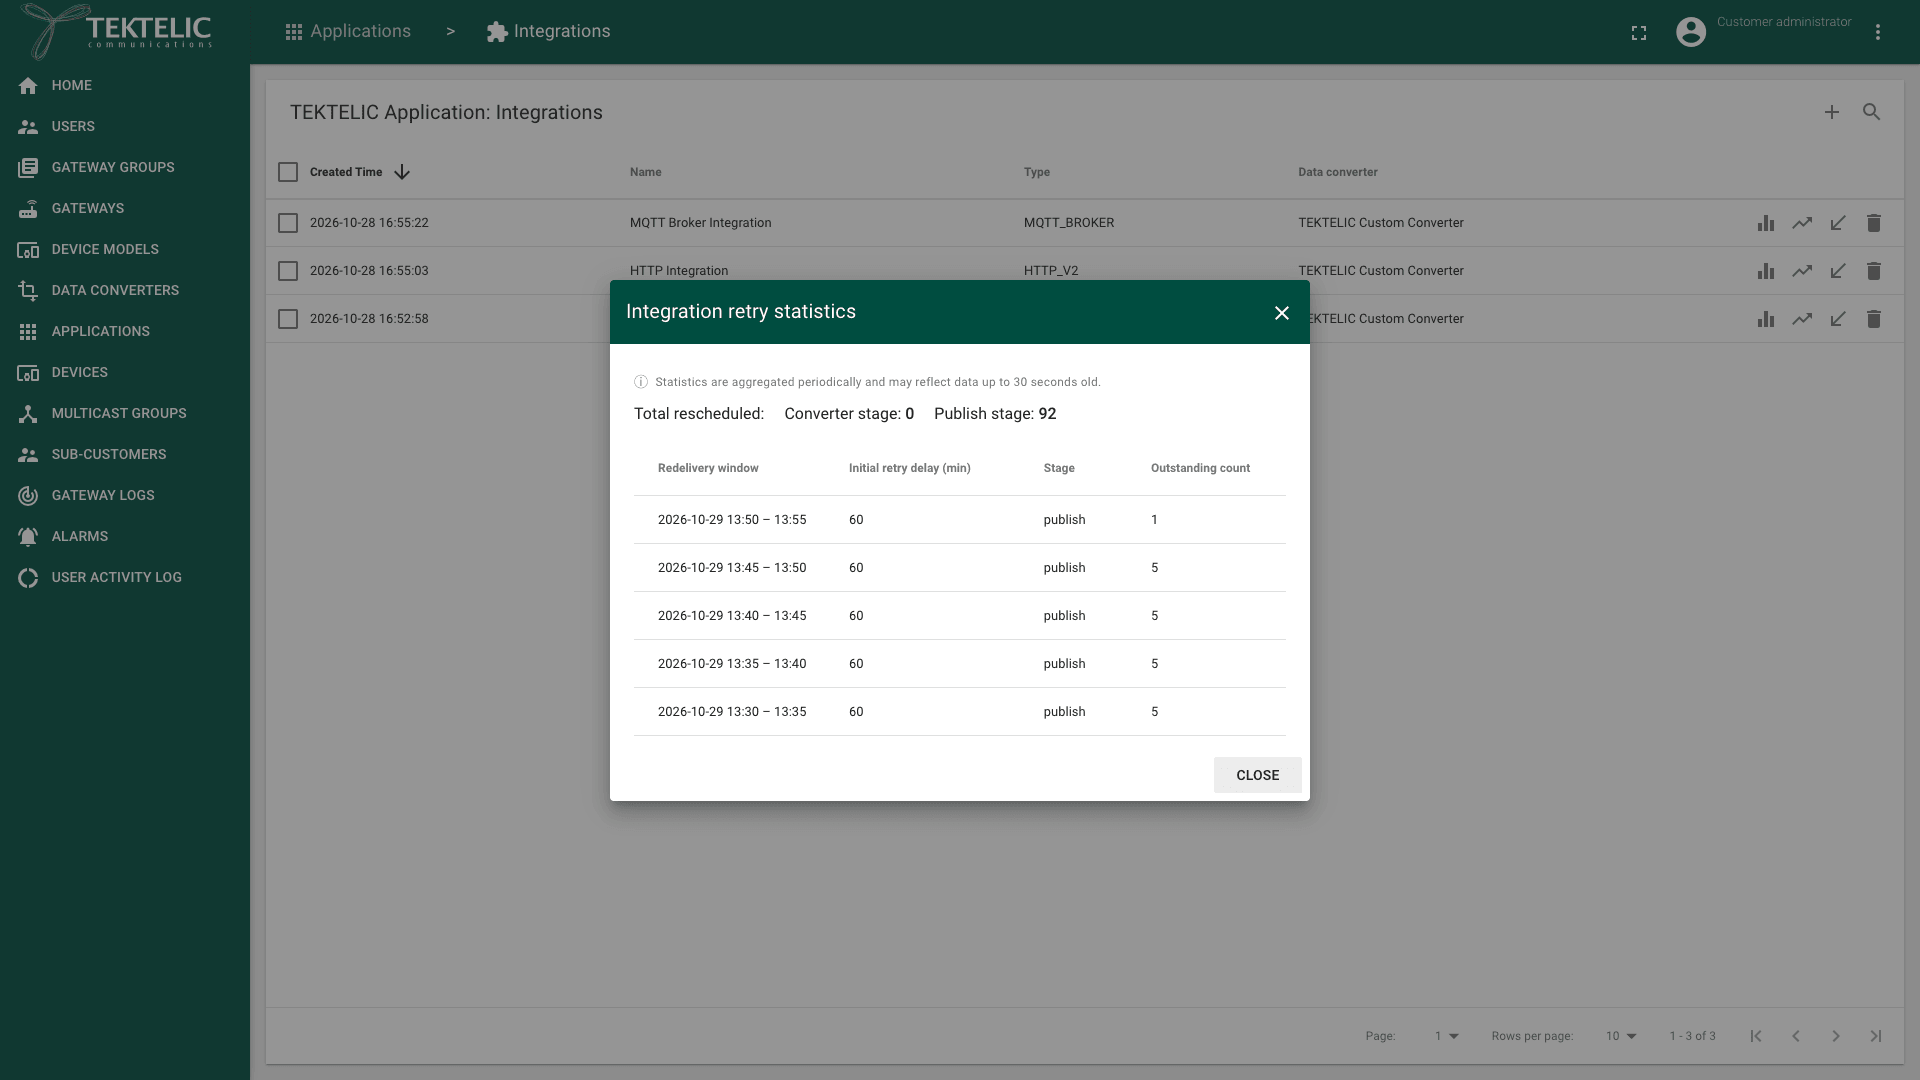
Select Show retry statistics (the bar chart icon). The Integration retry statistics dialog opens. It shows the uplinks that failed and wait for another attempt:
- Total rescheduled: the number of waiting uplinks, by Converter stage and Publish stage. Converter stage counts retries caused by converter-related issues. Publish stage counts retries caused by delivery or publishing issues.
- The table: each Redelivery window with its Initial retry delay (min), the Stage and the Outstanding count. The delays match the steps of the integration's Retry scheme, for example
5,30and60for the default scheme. - For MQTT_V2, the dialog also shows In-flight, Pending queue and the Sampling time. Its tooltip gives the order:
When nothing waits, the dialog shows .
-
Select Close.
-
Select Show DL statistics (the arrow icon). The Integration DL Statistics dialog opens. It counts the downlinks your system sent through the integration, as DL Received per Time window. With no downlinks, it shows .
Every dialog shows this note: So a delivery that just happened can take up to 30 seconds to appear.
To read the same statistics from your own system, use Get ul delivery statistics, Get retry statistics and Get dl statistics.
Check the data converter
A delivery can also fail before it leaves KONA Core: in the data converter of the integration.
-
In the side menu, select Data converters. The Data converters page lists your converters. The columns Decoder banned and Encoder banned show Yes for a converter that KONA Core has banned.
-
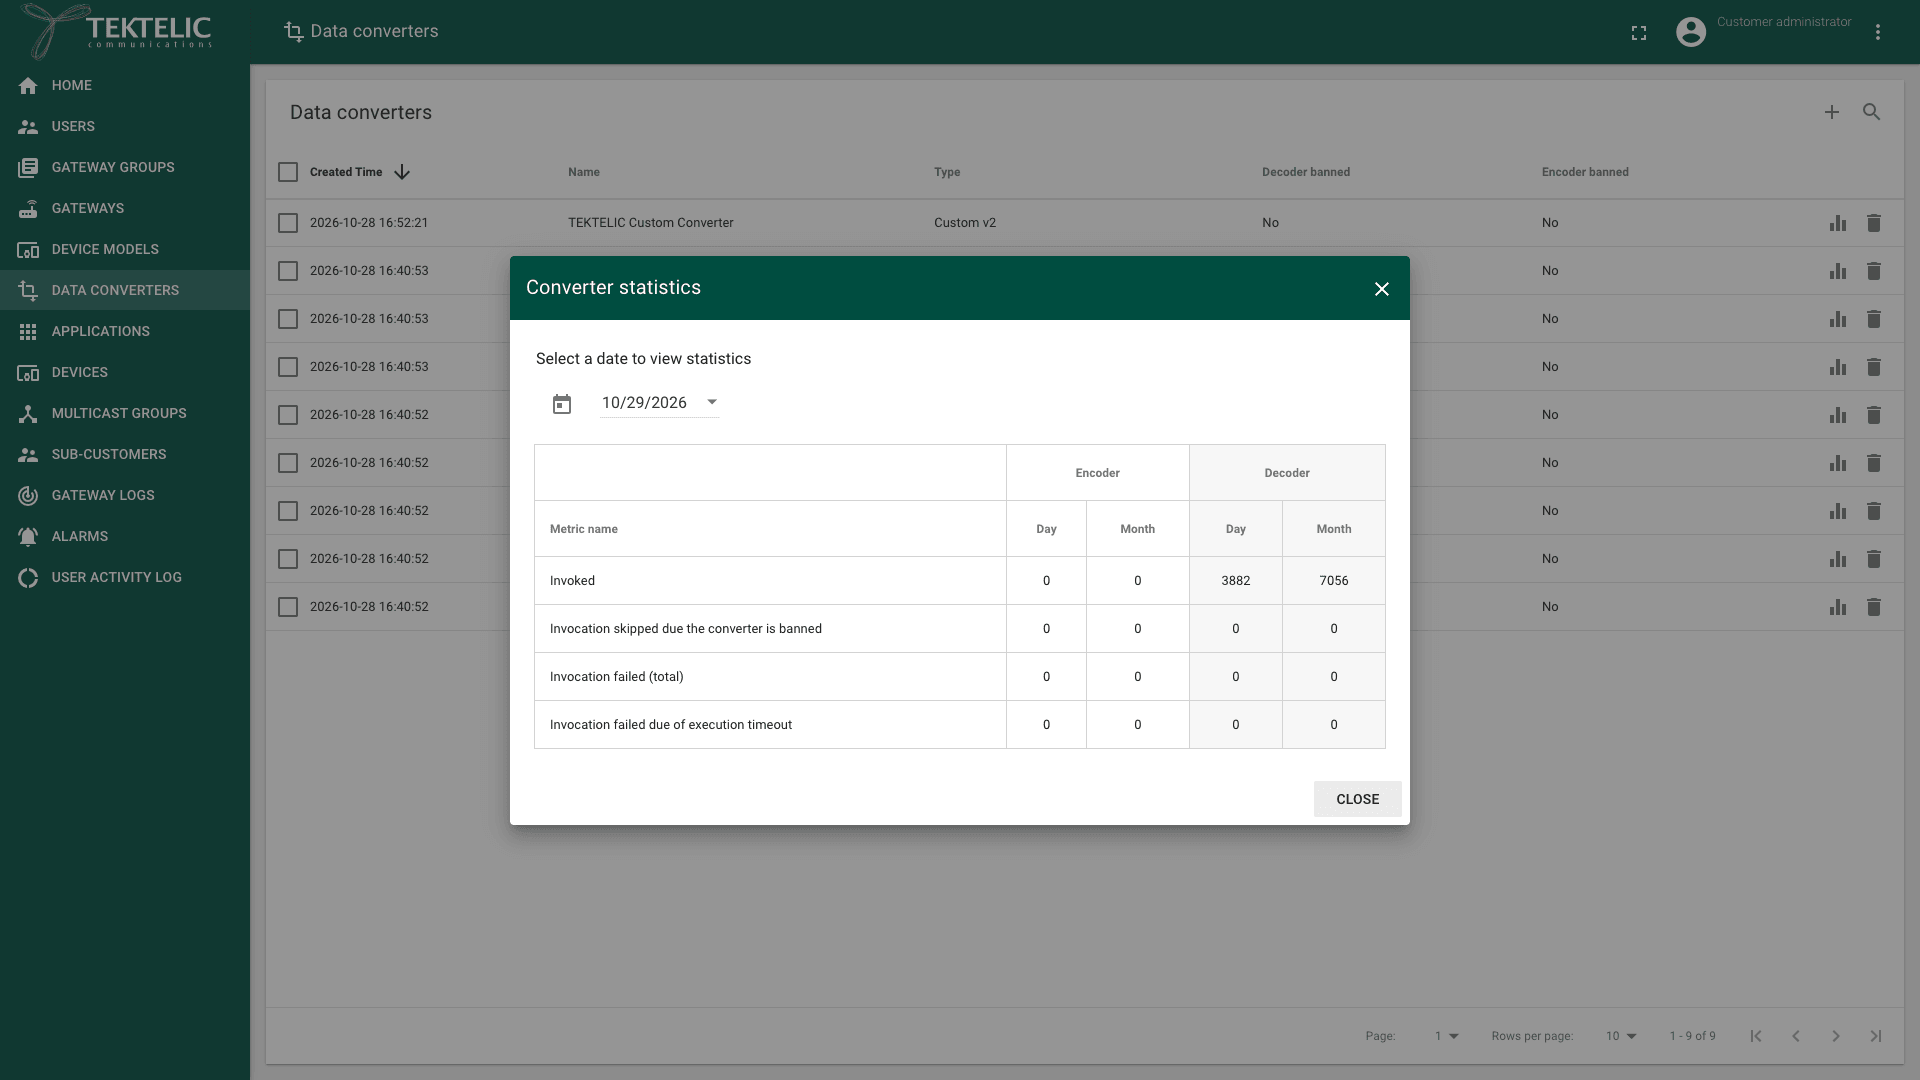
In the converter's row, select Show converter statistics (the bar chart icon). The Converter statistics dialog opens.
-
Under Select a date to view statistics, select the date. The table shows each metric for the Encoder and the Decoder, for that Day and its Month:
- Invoked: how often the code ran.
- Invocation skipped due the converter is banned: runs KONA Core skipped during a ban.
- Invocation failed (total): runs that failed, for any reason.
- Invocation failed due of execution timeout: runs that took longer than the execution timeout.
-
Select Close.
The converter form states the ban rule. The execution timeout is 100 ms. Code that exceeds it 5 times within 600 seconds is banned for 30 minutes. A banned converter's editor shows (or the same for the encoder). To fix the code, see Write a Decoder and Write an Encoder.
Get notified of failures
You don't need to watch these pages. Add an alarm rule to the application, and KONA Core sends you an email, an SMS or an MQTT message when an integration fails. The triggers for integrations and data converters come in pairs:
| Raise trigger | Clear trigger |
|---|---|
| Integration is disconnected | Integration is connected |
| Decoder is banned | Decoder is unbanned |
| Encoder is banned | Encoder is unbanned |
We recommend a rule with Integration is disconnected and Integration is connected for every integration that feeds a production system. Add both triggers of a pair: you then learn when a problem starts and when it ends. For the steps, see Configure Application Alarm Rules and Alarm Notifications. To feed the events into your own system, see Events over MQTT.
Check the result
The integration delivers data when all of these are true:
- Alarms: with Entity set to Integration and Raised only selected, the integration has no
INTEGRATION_DISCONNECTEDalarm. After a failure, its history showsINTEGRATION_FIRST_ULonce delivery works again. - UL delivery: Show UL delivery statistics shows Delivered counts in the recent time windows.
- Retries: Show retry statistics shows , or an Outstanding count that goes down.
- Converter: Decoder banned shows No, and Invocation failed (total) for the decoder doesn't grow.
- Your system: it receives the uplinks. For the message format, see Message Formats.
Troubleshooting
| Symptom | Likely cause | What to do |
|---|---|---|
INTEGRATION_DISCONNECTED is raised, and Publish stage in the retry statistics grows. | Your system doesn't accept deliveries: the endpoint or broker is down, unreachable or rejects the request. | Read the alarm description for the cause, such as an HTTP status. Fix the endpoint or the integration settings. See the troubleshooting of HTTP Integration or MQTT Integration. Waiting uplinks get their next attempt by the Retry scheme. |
Invocation failed (total) grows, INTEGRATION_UL_DECODING_FAILURE appears, or Decoder banned shows Yes. | The decoder throws an error or exceeds the execution timeout of 100 ms for these payloads. | Test the decoder with the payload from the event description, and fix it. KONA Core lifts a ban after 30 minutes. See Write a Decoder. |
| The statistics stay empty, and your system receives nothing, but no alarm is raised. | The integration gets no uplinks: the devices send none, or the filters exclude them. | Check that the devices send uplinks, in the device's Real-time packets tab. In the integration, check Allow messages with ports and Send empty payload. Wait 30 seconds for the statistics to update. |
Still stuck? A Sub-Customer contacts their Customer, a Customer contacts their Provider, and a Provider contacts TEKTELIC Support. Send the application and integration names, the time in UTC, the alarm description, and screenshots of the retry and converter statistics. Remove passwords, tokens and endpoint credentials from what you send.
Related
- HTTP Integration
- MQTT Integration
- MQTT Broker Integration
- Integrations Overview
- Payload Converters Overview
- Work with Alarms
- Alarms & Events Reference
- Configure Application Alarm Rules
- Alarm Notifications
- Events & Alarms
- Uplink & Downlink Data Flow
- Glossary
- API Reference: Get ul delivery statistics, Get retry statistics, Get dl statistics and Get converter decoder stats by converter id.