Usage Statistics & Reports
Overview
Check how much of your plan you use in TEKTELIC KONA Core Network Server, and how your gateways and devices are used over time. The UI shows current counts per organization and per application, and message counts per data converter by day and month.
The UI has no chart or table of messages, devices or gateways over time, and no usage report to export. For usage over time, use the statistics operations of the REST API.
Before you start
- Role: any role. Each role sees the counts of its own organization and of the organizations below it. The Customer details page is for Customer roles. See Users, Roles & Permissions.
- Plan: to compare usage with your limits, know your plan. See Subscription Plans & Limits.
Steps
Where to find each statistic
| Statistic | Period | Where | Who |
|---|---|---|---|
| Sub-Customers, gateways and devices used out of the plan maximum | Now | Top bar three-dot menu > Customer details | Customer |
| #of Sub-Customers, #of GWs and #of Devices per Customer | Now | Customers page | Provider |
| #of Devices per Sub-Customer | Now | Sub-Customers page | Customer |
| Number of devices per application | Now | Applications page | Customer, Sub-Customer |
| Converter invocations and failures, for encoder and decoder | Day and Month of a date you select | Data converters > Show converter statistics | Customer, Sub-Customer administrator |
| Integration delivery and retry statistics | Depends on the statistic | Applications > Manage integrations | Customer, Sub-Customer |
| Active, maximum and total devices and gateways | Day or month | REST API only | Depends on the operation |
Check your plan usage (Customer)
-
In the top bar, select the three-dot menu next to your role.
-
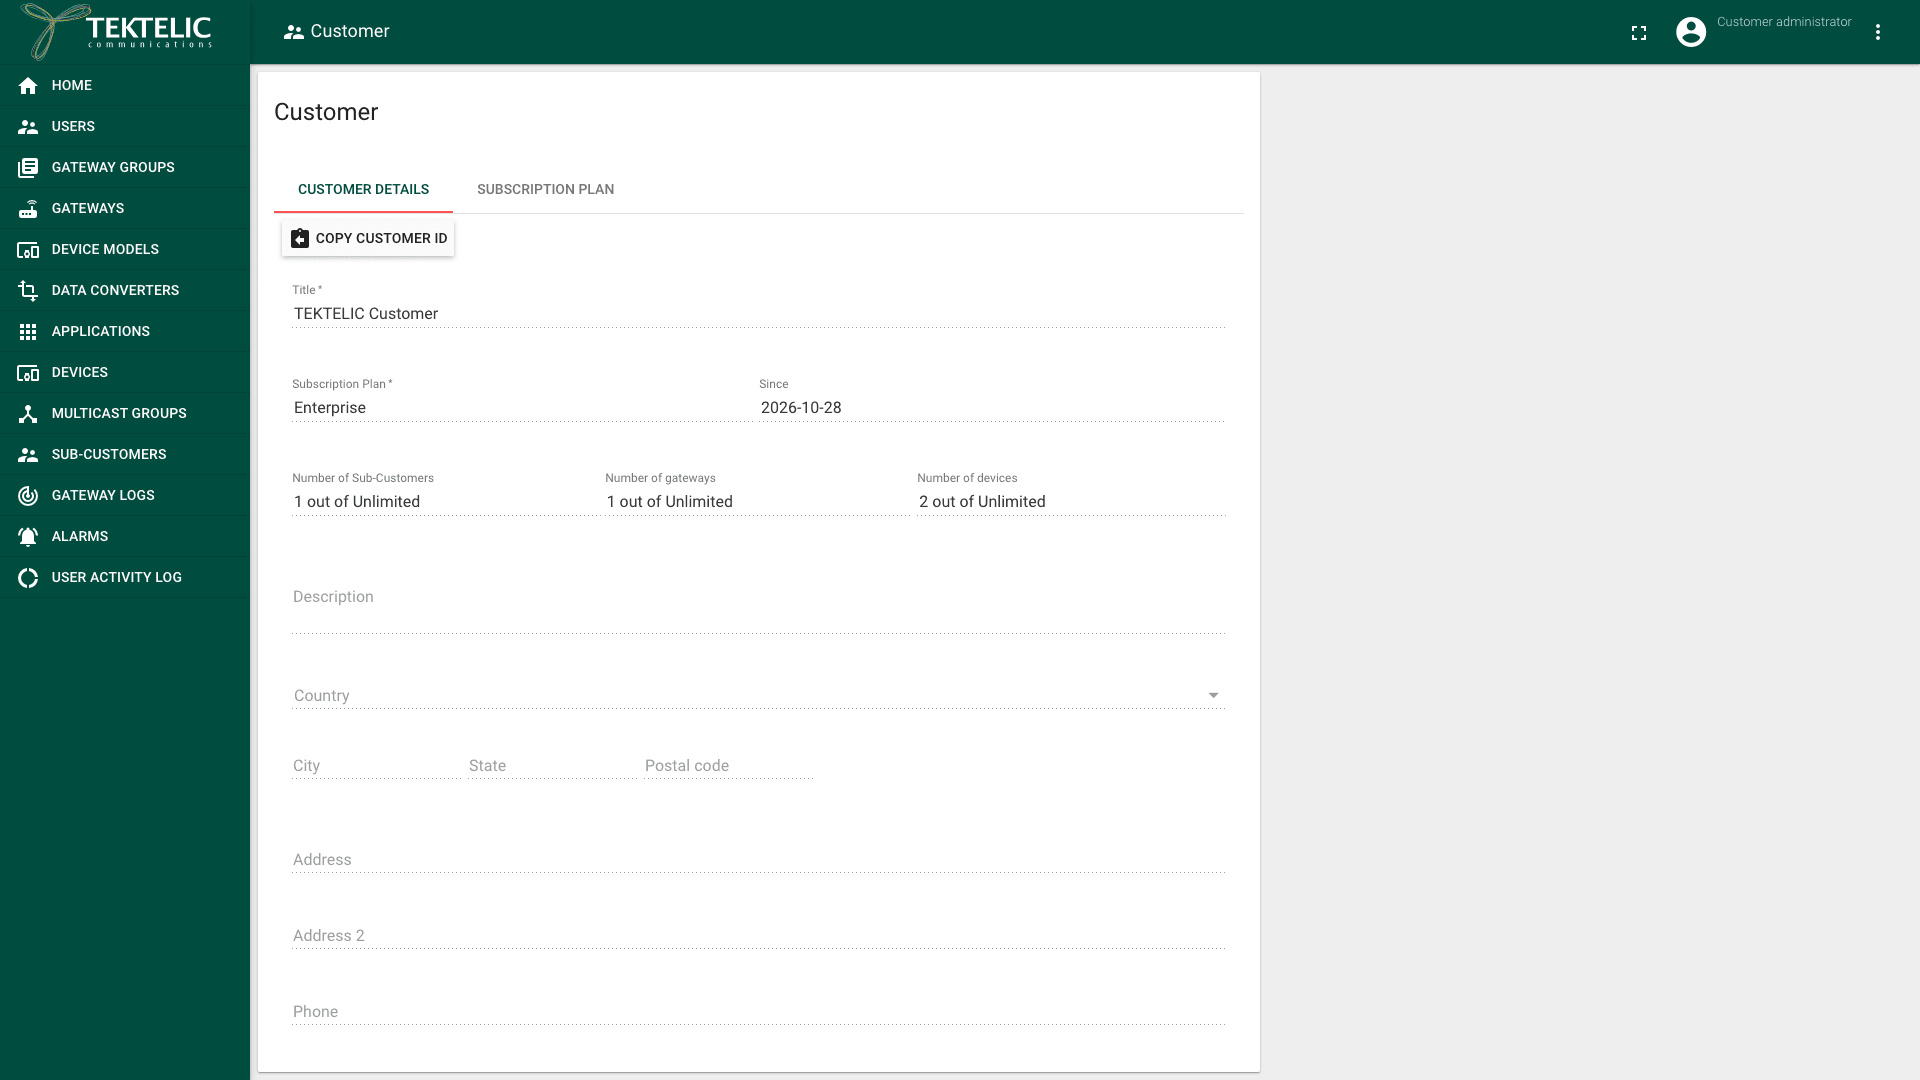
Select Customer details. The Customer page opens on the Customer details tab.
-
Read Number of Sub-Customers, Number of gateways and Number of devices. Each shows the count out of the plan maximum, for example "2 out of Unlimited".
-
Optional: select the Subscription Plan tab to compare with every maximum of the plan, including applications and integrations.
The page doesn't show the number of applications or integrations in use. Count them on the Applications page and on each application's integrations page.
Check usage per Customer (Provider only)
- In the side menu, select Customers.
- Read #of Sub-Customers, #of GWs and #of Devices in each Customer's row. The Subscription Plan column shows the plan that limits them.
Customers page with the #of Sub-Customers, #of GWs and #of Devices columns. The page is for Provider roles; the test account is a Customer administrator.
Check usage per Sub-Customer and application (Customer)
- In the side menu, select Sub-Customers. The #of Devices column shows the number of devices of each Sub-Customer.
- In the side menu, select Applications. The Number of devices column shows the devices in each application.
Check converter statistics by day and month
Converter statistics count how often KONA Core ran a data converter on uplinks and downlinks.
- In the side menu, select Data converters.
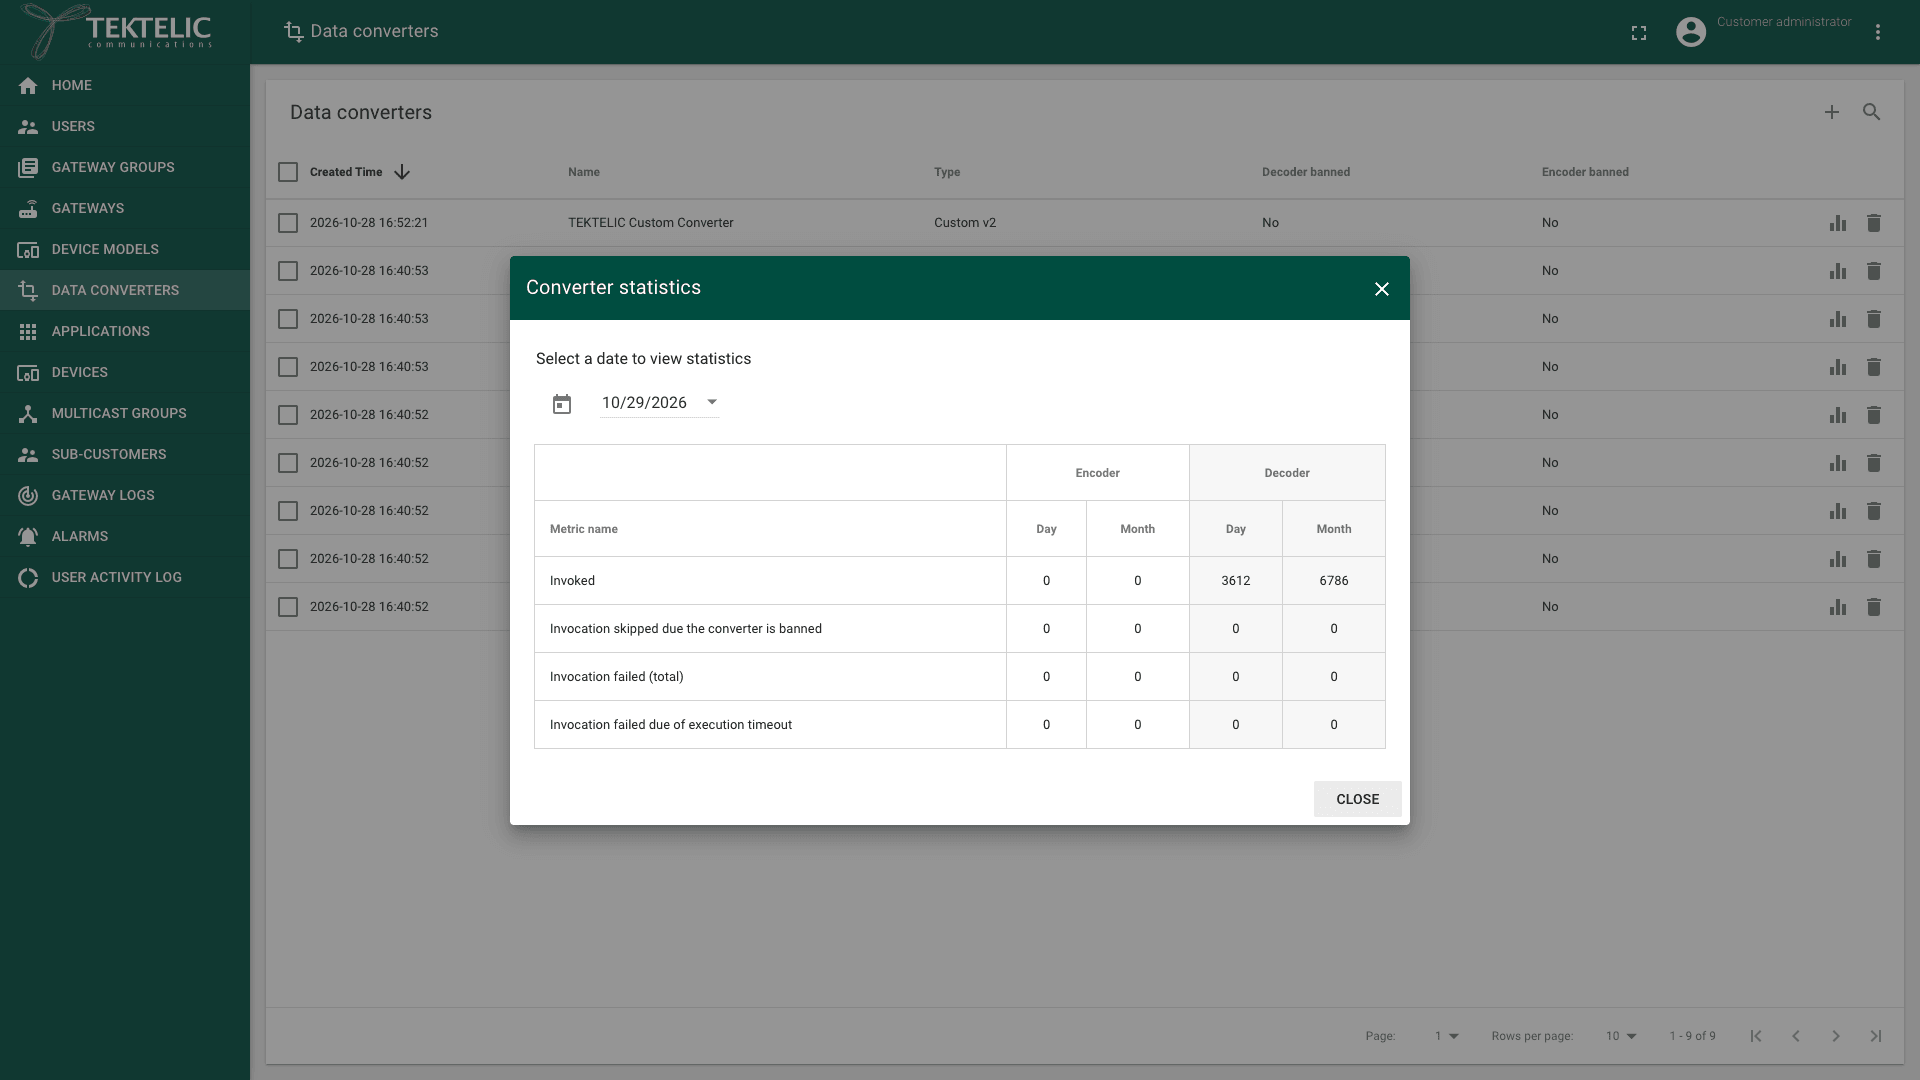
- In the converter's row, select the Show converter statistics icon (the bar chart icon). The Converter statistics dialog opens for today's date.
- To see another period, select a date under Select a date to view statistics. The table shows the values for that Day and for its Month.
- Read the metrics for the Encoder and the Decoder:
- Invoked: how often the converter ran.
- Invocation skipped due the converter is banned
- Invocation failed (total)
- Invocation failed due of execution timeout
- Select Close.
For when a converter is banned, see Payload Converters Overview. confirm whether the Day and Month periods are counted in UTC.
Check integration statistics
Integrations of the types HTTP, HTTP_V2, MQTT_V2 and MQTT_V2_EMBEDDED show uplink delivery, downlink and retry statistics on the application's integrations page. For the steps, see Integration Monitoring.
Get usage over time from the API
The UI shows message counts only per converter and per integration. It has no total of uplinks or downlinks over time. For usage over time, use the statistics operations of the REST API. They return counts for a day or a month that you pass:
- Active devices and gateways per Provider, Customer, Sub-Customer, application or gateway group: Active devices statistics and Active gateways statistics.
- The highest device and gateway count in a month: Max devices statistics and Max gateways statistics.
- The current totals: Total devices statistics and Total gateways statistics.
- Uplinks and downlinks processed by integrations, per Customer, application or integration, and converter counts: Integrations statistics and Converter statistics.
Use YYYY-MM-DD for day and YYYY-MM for month. confirm the exact traffic conditions counted as active for devices and gateways.
Export a report
The UI has no usage report and no export of usage statistics. To build a report, call the statistics operations above for each month and save the results. To list the active devices or gateways of a month, use Active devices set statistics with credentials and Active gateways set statistics with credentials. Their operation names end with "tabular". confirm the returned tabular format.
To export a record of user actions instead, see User Activity Log.
Check the result
- Customer details shows a count out of a maximum for Sub-Customers, gateways and devices, for example "1 out of Unlimited".
- The Converter statistics dialog shows values for the date you selected. A 0 in Invoked means the converter didn't run in that period.
- When a count reaches the plan maximum, adding another resource of that type fails. See When a limit is reached.
Related
- Subscription Plans & Limits: the maximums your usage counts against.
- Manage Subscriptions: change a Customer's plan.
- Integration Monitoring: delivery and retry statistics of integrations.
- Monitor Gateways: gateway state and traffic.
- Device Activity & Status: when each device was last seen.
- General statistics operations in the API Reference: combined statistics of all Customers.