Device Activity & Status
Overview
Check in TEKTELIC KONA Core Network Server whether a LoRaWAN® device works. You read its status and last activity time, check the signal quality of its uplinks and browse its uplink history. At the end, you know whether the device sends data, how well the gateways receive it, and when to look closer.
Before you start
- Role: any Customer or Sub-Customer role. User roles see the same values read-only. Provider roles have no top-level Devices page. Their access to their own Customers is described in Tenancy Model. See Users, Roles & Permissions.
- Device: added to KONA Core. See Onboard a TEKTELIC Device.
- Gateway: at least one gateway near the device shows Online. See Monitor Gateways.
Steps
Check the status of your devices
-
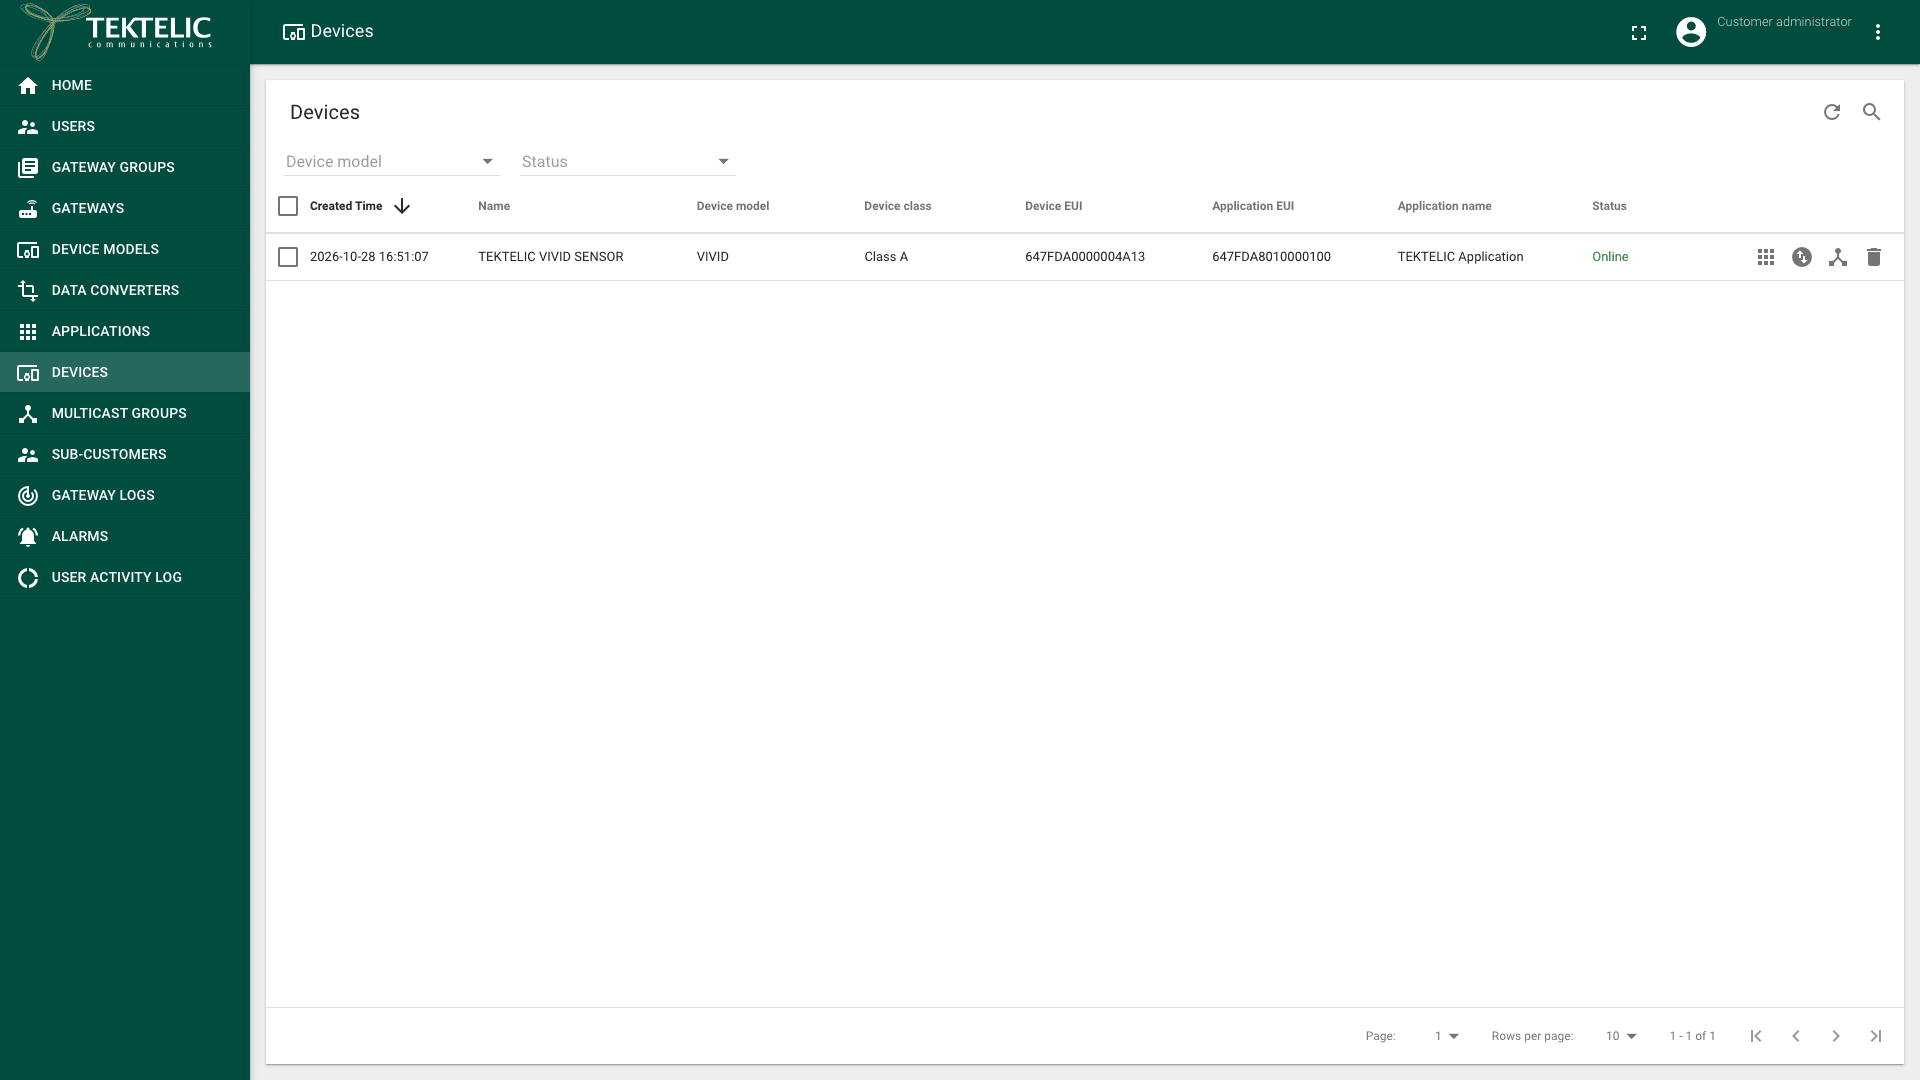
In the side menu, select Devices. The Devices page lists every device you can see, with its Device class and Status.
-
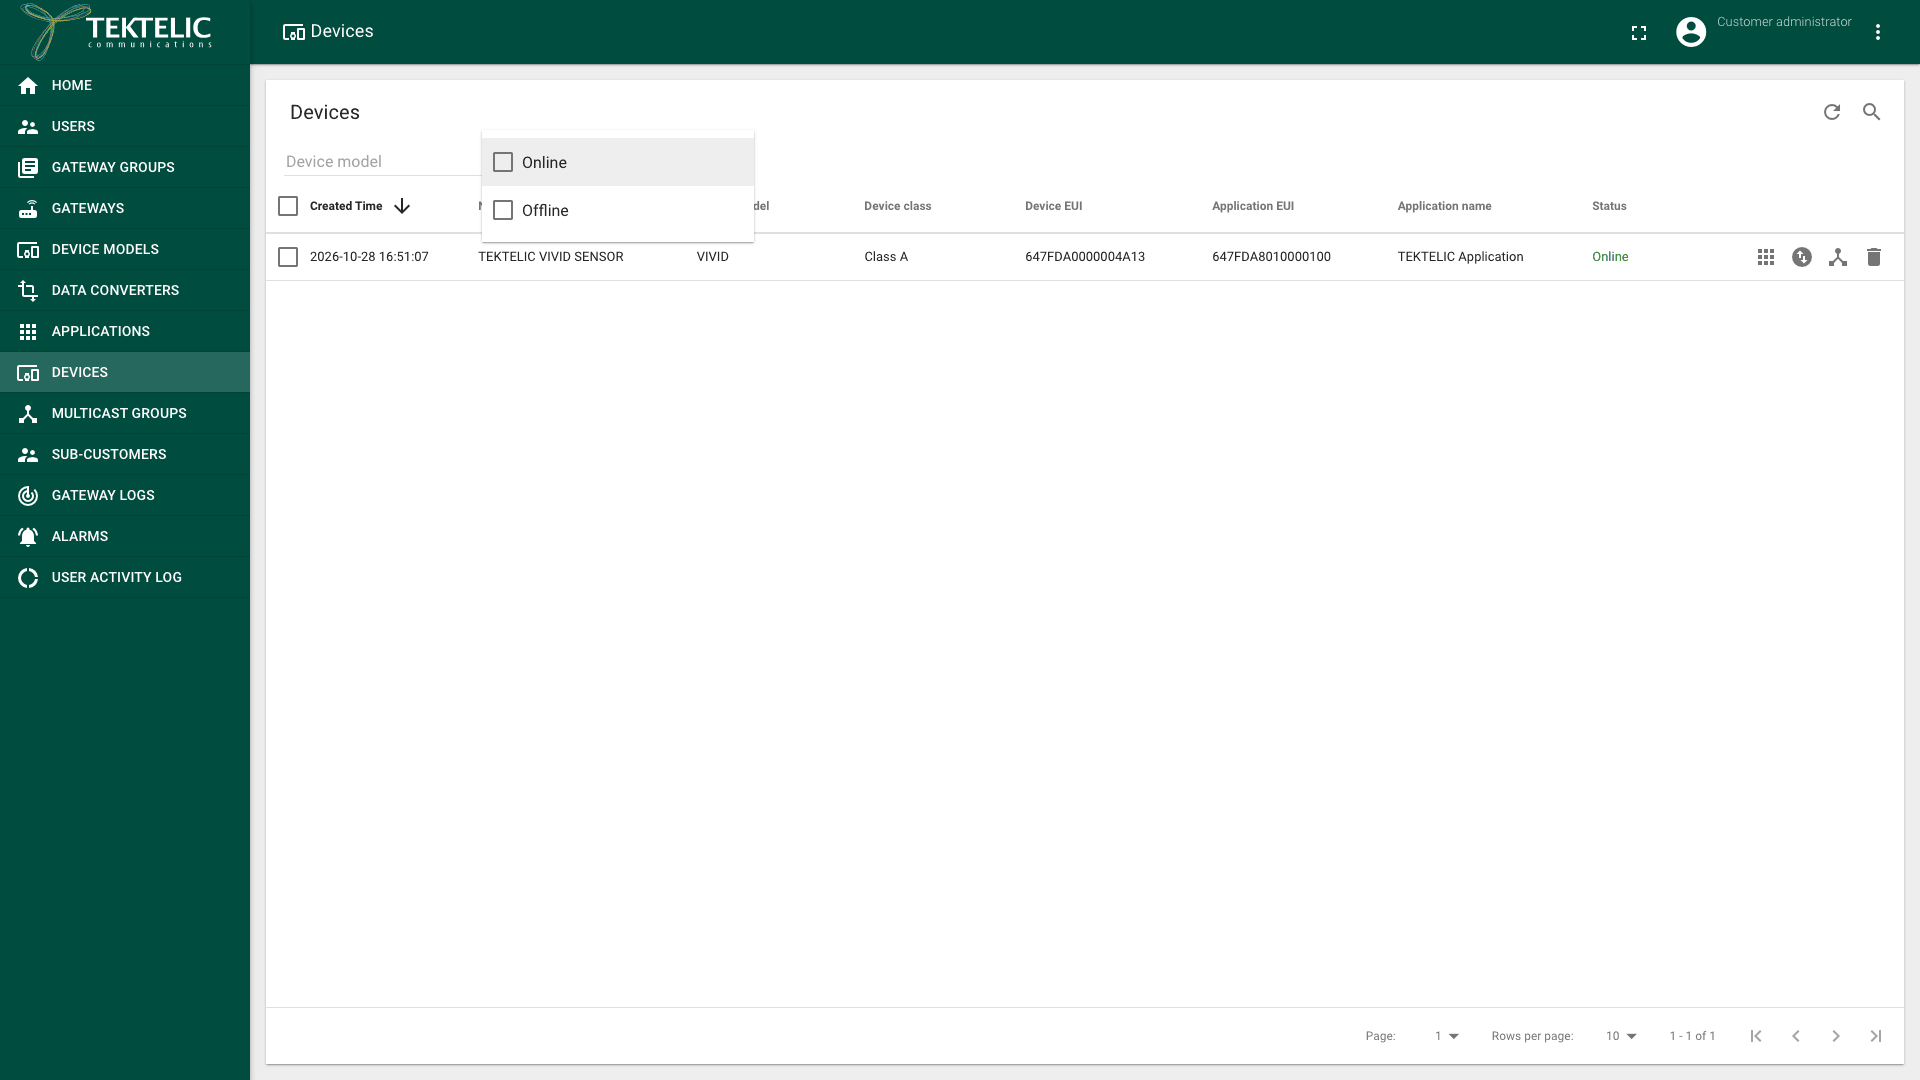
To see only devices with one status, open the Status filter and select Online or Offline. You can also filter by Device model.
-
Select the refresh icon to load the current statuses.
A device has one of two statuses:
| Status | Meaning | What to do |
|---|---|---|
| Online (green) | KONA Core counts the device as active: it receives the device's uplinks. | Nothing. Check the signal quality from time to time. |
| Offline (red) | KONA Core hasn't received an uplink from the device recently, or never did. | A new device shows Offline until it joins and sends its first uplink. This is expected. For a device that was Online before, see Troubleshooting. |
The device becomes Offline when it sends no uplink for its Inactivity timeout (sec). The default is 3600 seconds (1 hour).
Check the last activity of one device
-
Select the device's name in the list. The Device details panel opens on the Device details tab.
-
Read Status and Last activity time. Last activity time uses the browser's local time, in the format
yyyy-MM-dd HH:mm:ss.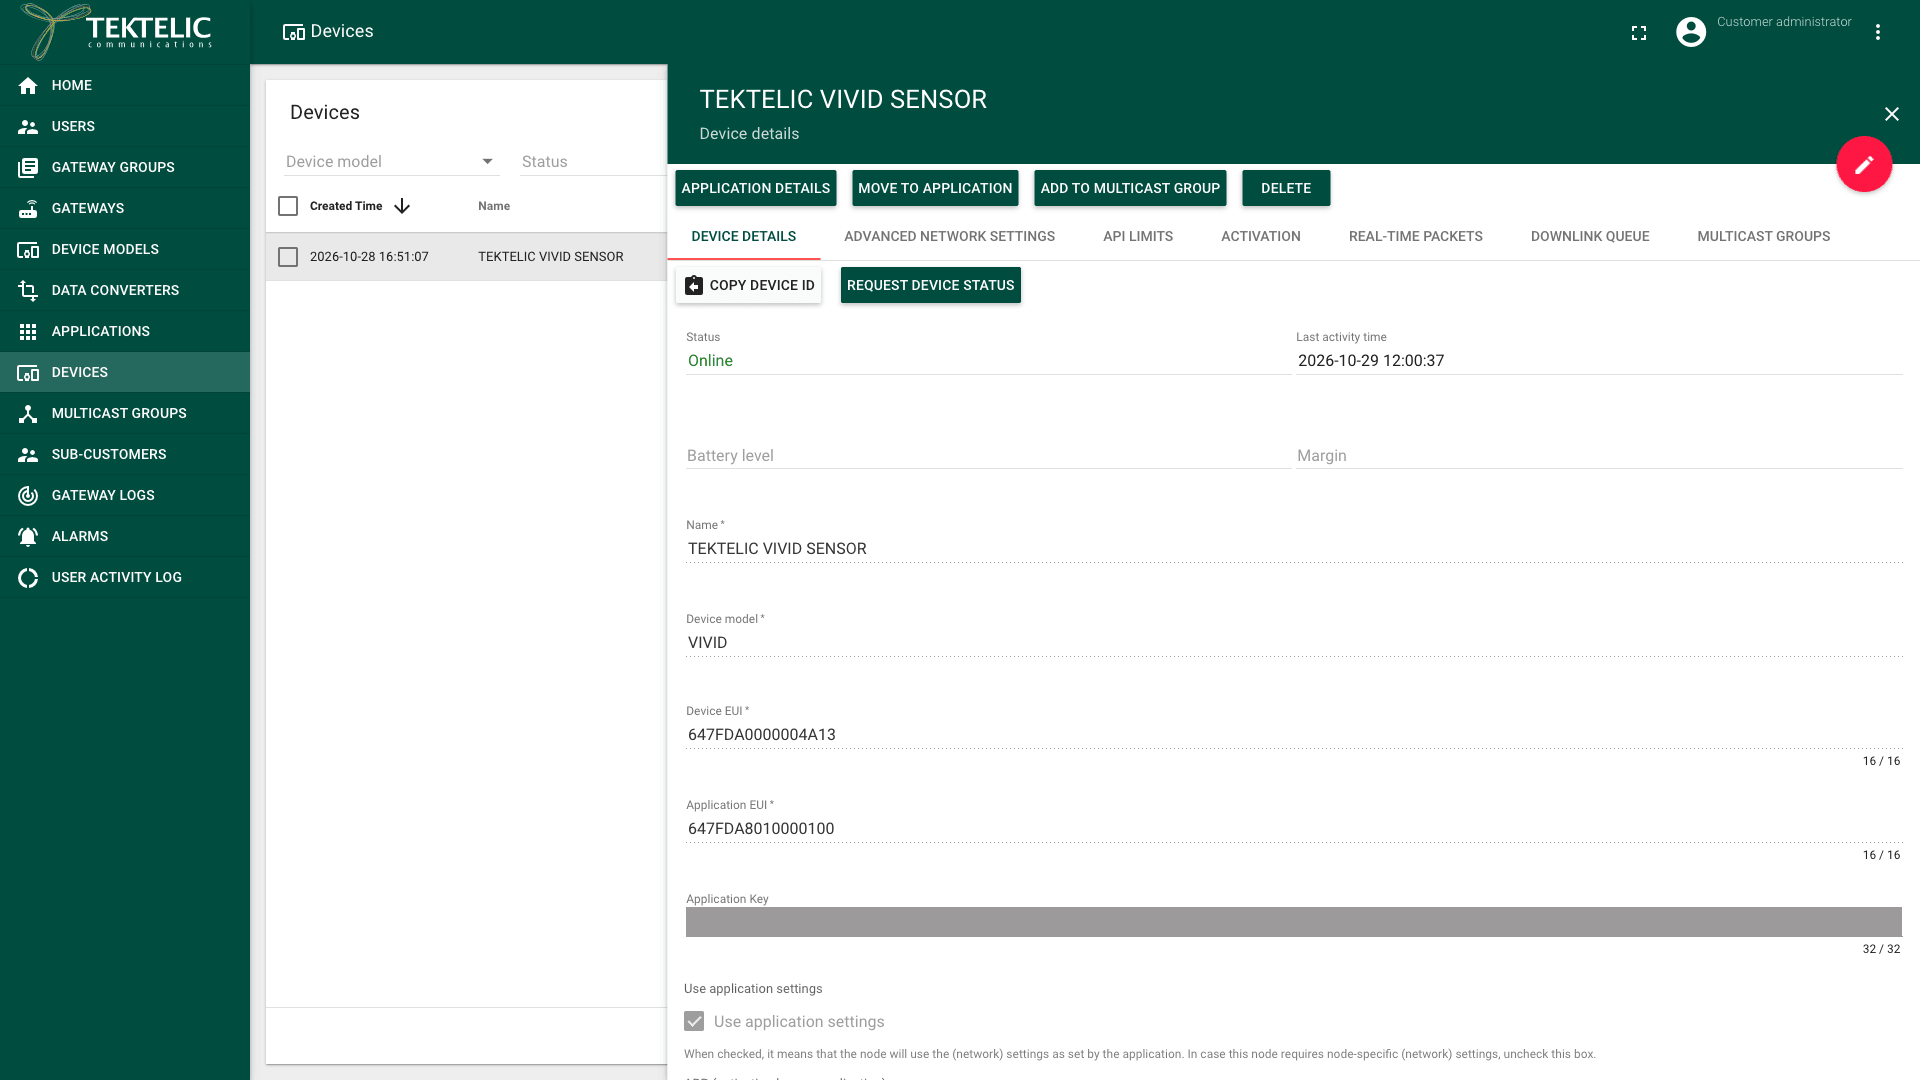
-
Compare Last activity time with the device's reporting interval. A device is healthy when the time since its last activity is shorter than one reporting interval. The interval is set on the device itself: for a TEKTELIC device, see its user guide.
-
Optional: select Request device status to ask the device for its battery level and radio margin. KONA Core shows and sends the request in a downlink. A Class A device receives it after its next uplink.
-
After the device answers, read Battery level and Margin. Battery level shows a percentage, or . Margin shows the device's demodulation margin of the request, in dB.
The request costs the device a downlink and an uplink. We recommend it for troubleshooting, not on a schedule.
Check the signal quality
-
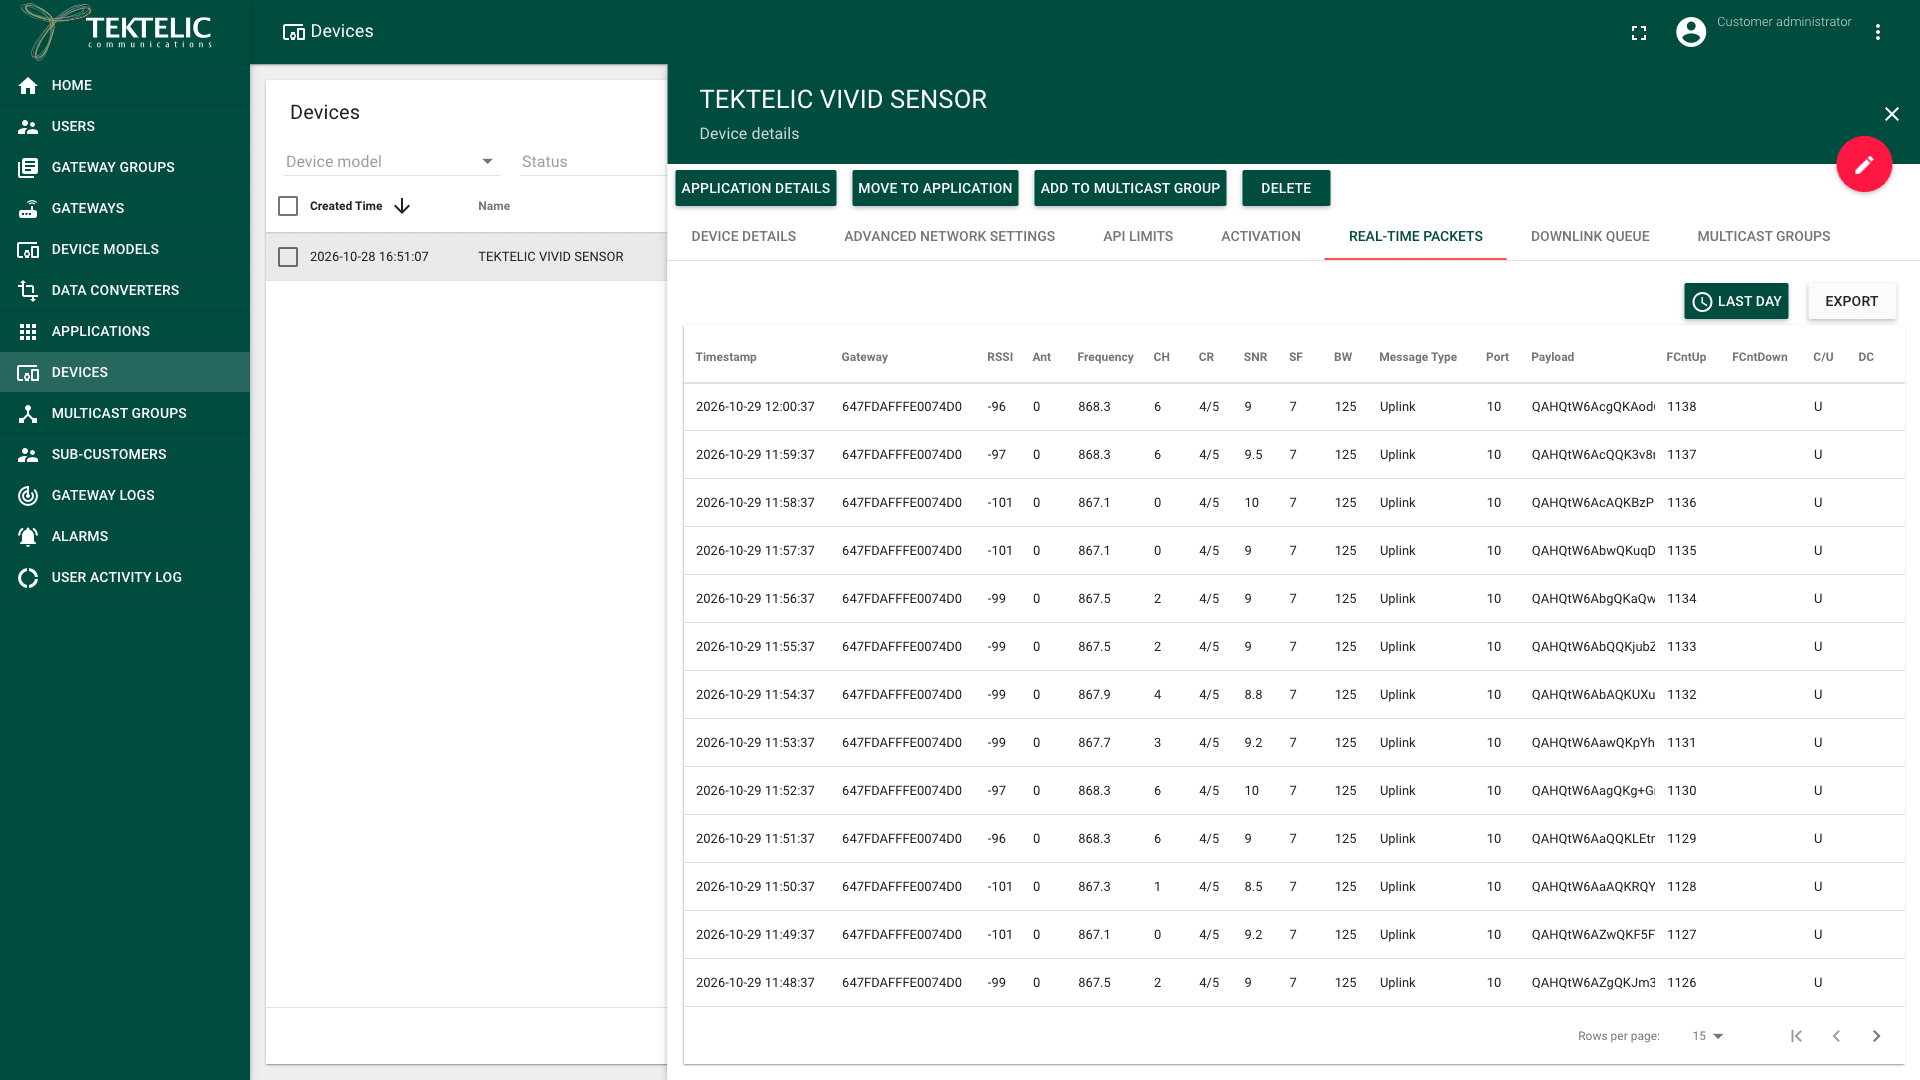
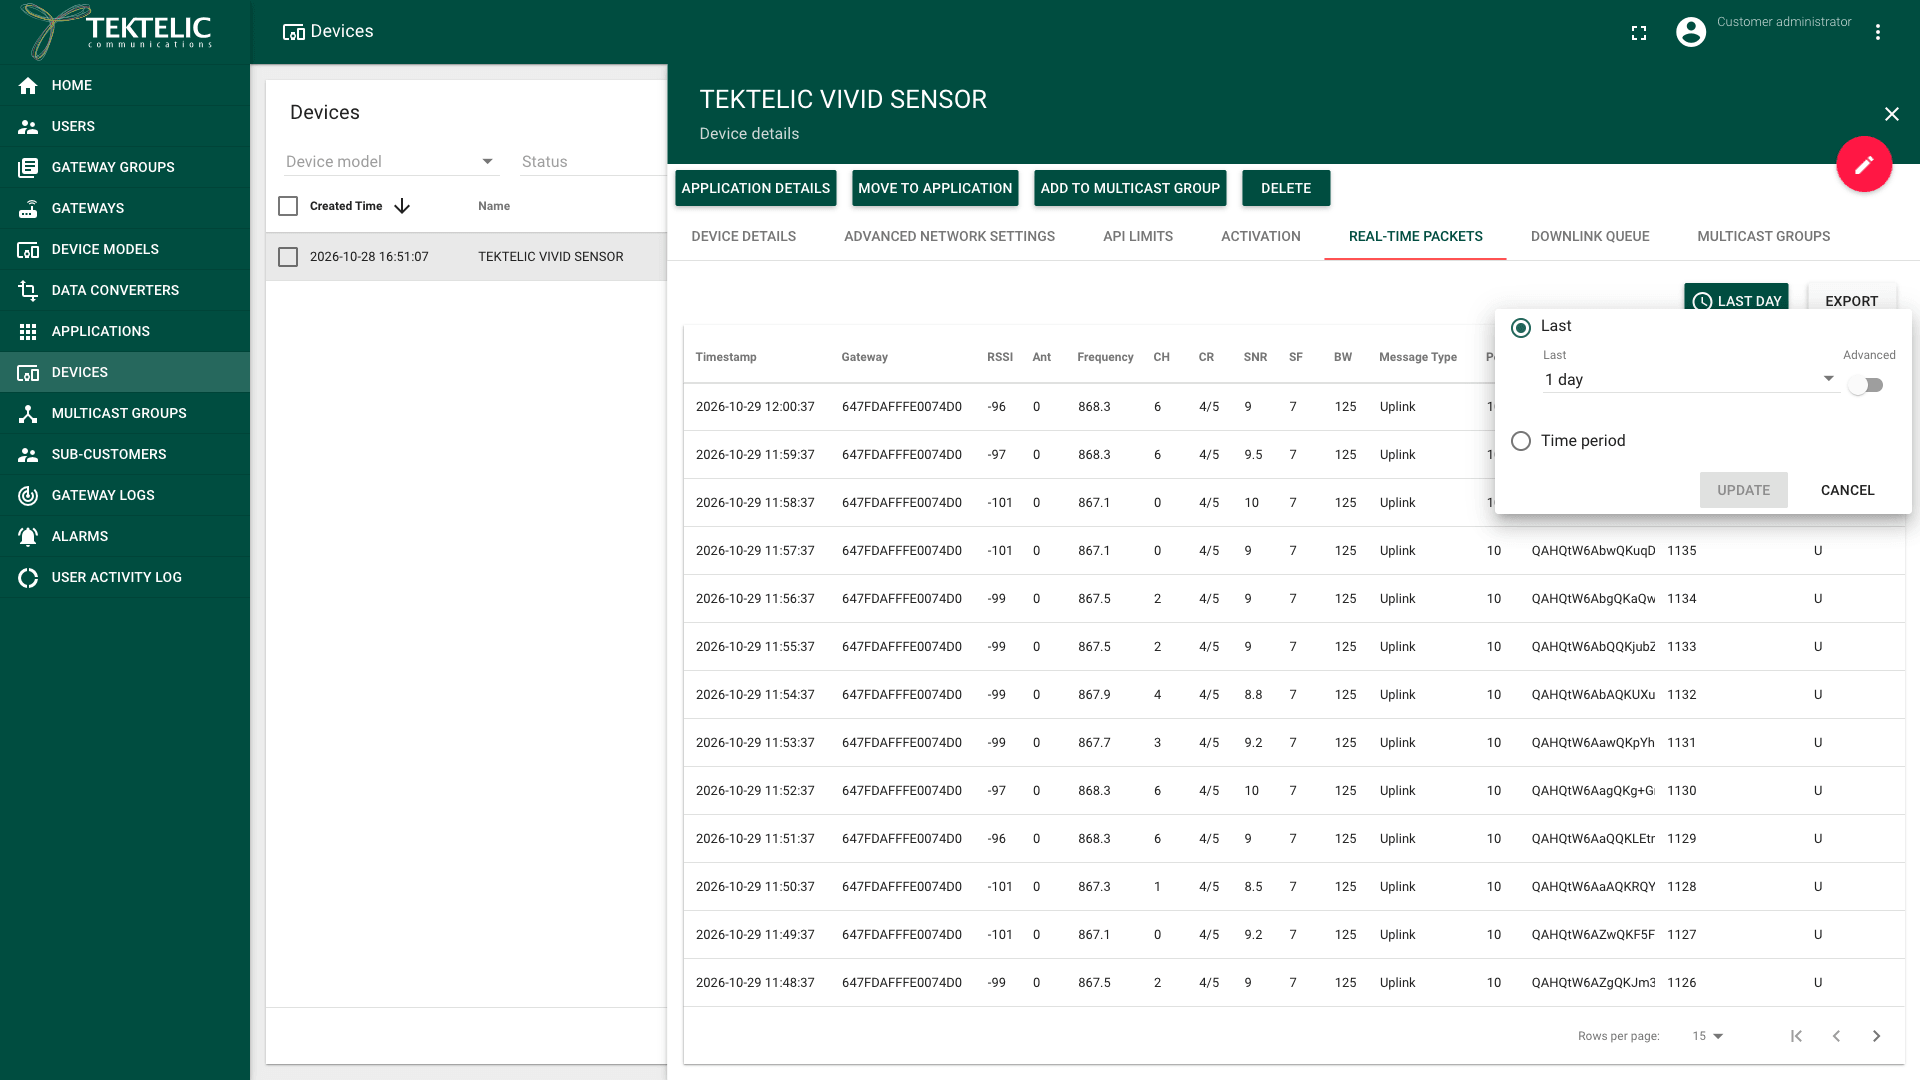
On the device panel, select the Real-time packets tab. It lists the device's packets for the last day, newest first.
-
For each uplink, read these columns:
- Gateway: the GW-ID of the gateway that received the uplink.
- RSSI: the received signal strength, in dBm. Closer to 0 is stronger.
- SNR: the signal-to-noise ratio, in dB. Higher is better.
- SF: the spreading factor. A higher SF reaches farther but takes longer to send.
-
Compare signal quality over several uplinks and across the receiving gateways. For hardware-specific reception limits, use the gateway's technical documentation.
A single weak uplink is normal. Look at the trend over several uplinks. For how ADR uses the signal quality, see Adaptive Data Rate.
Browse the uplink history
-
On the Real-time packets tab, select the time window button. It shows Last day by default.
-
Select Last and choose a period, or select Time period and set a start and an end.
-
Select Update. The table shows the packets of that window.
-
Read the Message Type column: Uplink, Downlink, Join Request or Join Accept. FCntUp shows the uplink frame counter, and C/U shows C for a confirmed message and U for an unconfirmed one.
-
Optional: select Export to download the packets as a CSV file, named
real-time-packets. Its values are separated by semicolons, and it adds a timestamp in UTC to each row. With no packets in the window, Export stays disabled, with the hint
A gap in the FCntUp values means KONA Core didn't receive some uplinks. The Payload column shows the raw payload, not decoded values. For the path of an uplink, see Uplink & Downlink Data Flow.
Get alerted when a device goes offline
You don't need to check statuses by hand. KONA Core raises DEVICE_DATA_REPORTING_INTERVAL_EXCEEDED when a device doesn't send an uplink within its reporting interval. To be notified, add an alarm rule with the triggers Device is offline and Device is online to the device's application. See Configure Application Alarm Rules.
Check the result
You know the device works when:
- its Status is Online;
- its Last activity time is within one reporting interval;
- its recent uplinks show in Real-time packets without gaps in FCntUp;
- the RSSI and SNR of the best gateway are in the Good or Weak range.
To check statuses from your own system, use Get device online state and Get device activity state.
Troubleshooting
| Symptom | Likely cause | What to do |
|---|---|---|
| A new device stays Offline. | The device hasn't joined: wrong keys, a different frequency plan, or no gateway in range. | Check the DevEUI, JoinEUI and AppKey, and the gateway's status. See Onboard a TEKTELIC Device. |
| A device that worked is now Offline. | Empty battery, a gateway that went offline, or an ABP device that restarted its frame counters. | Check the gateways near the device. For an ABP device, see Device Session & Frame Counters. |
| Uplinks arrive with gaps in FCntUp. | The signal is at the limit, or the device is near the edge of coverage. | Check RSSI and SNR. Move the device or the antenna, or add a gateway closer to the device. |
Still stuck? A Sub-Customer contacts their Customer, a Customer contacts their Provider, and a Provider contacts TEKTELIC Support. Send the DevEUI, the time of the last uplink in UTC, the exported real-time-packets file and a screenshot of the Device details tab.