Gateway Logs
Overview
See every message your gateways exchange with TEKTELIC KONA Core Network Server: uplinks and downlinks, join requests, statistics, events and commands. You filter the Gateway logs page by gateway, device, message type and time, and open the full content of each message. The logs show what a gateway actually sent and received, so they help you and support find the cause of a problem.
Before you start
- Role: Provider administrator, Provider user, Customer administrator or Customer user. A Sub-Customer has no Gateway logs page. See Users, Roles & Permissions.
- Logging enabled: the gateway has Logging enabled selected on its Gateway details tab. The gateways list shows it in the Logging enabled column. confirm that KONA Core logs messages only for gateways with Logging enabled, and whether this setting is selected by default.
Steps
Find the logs
-
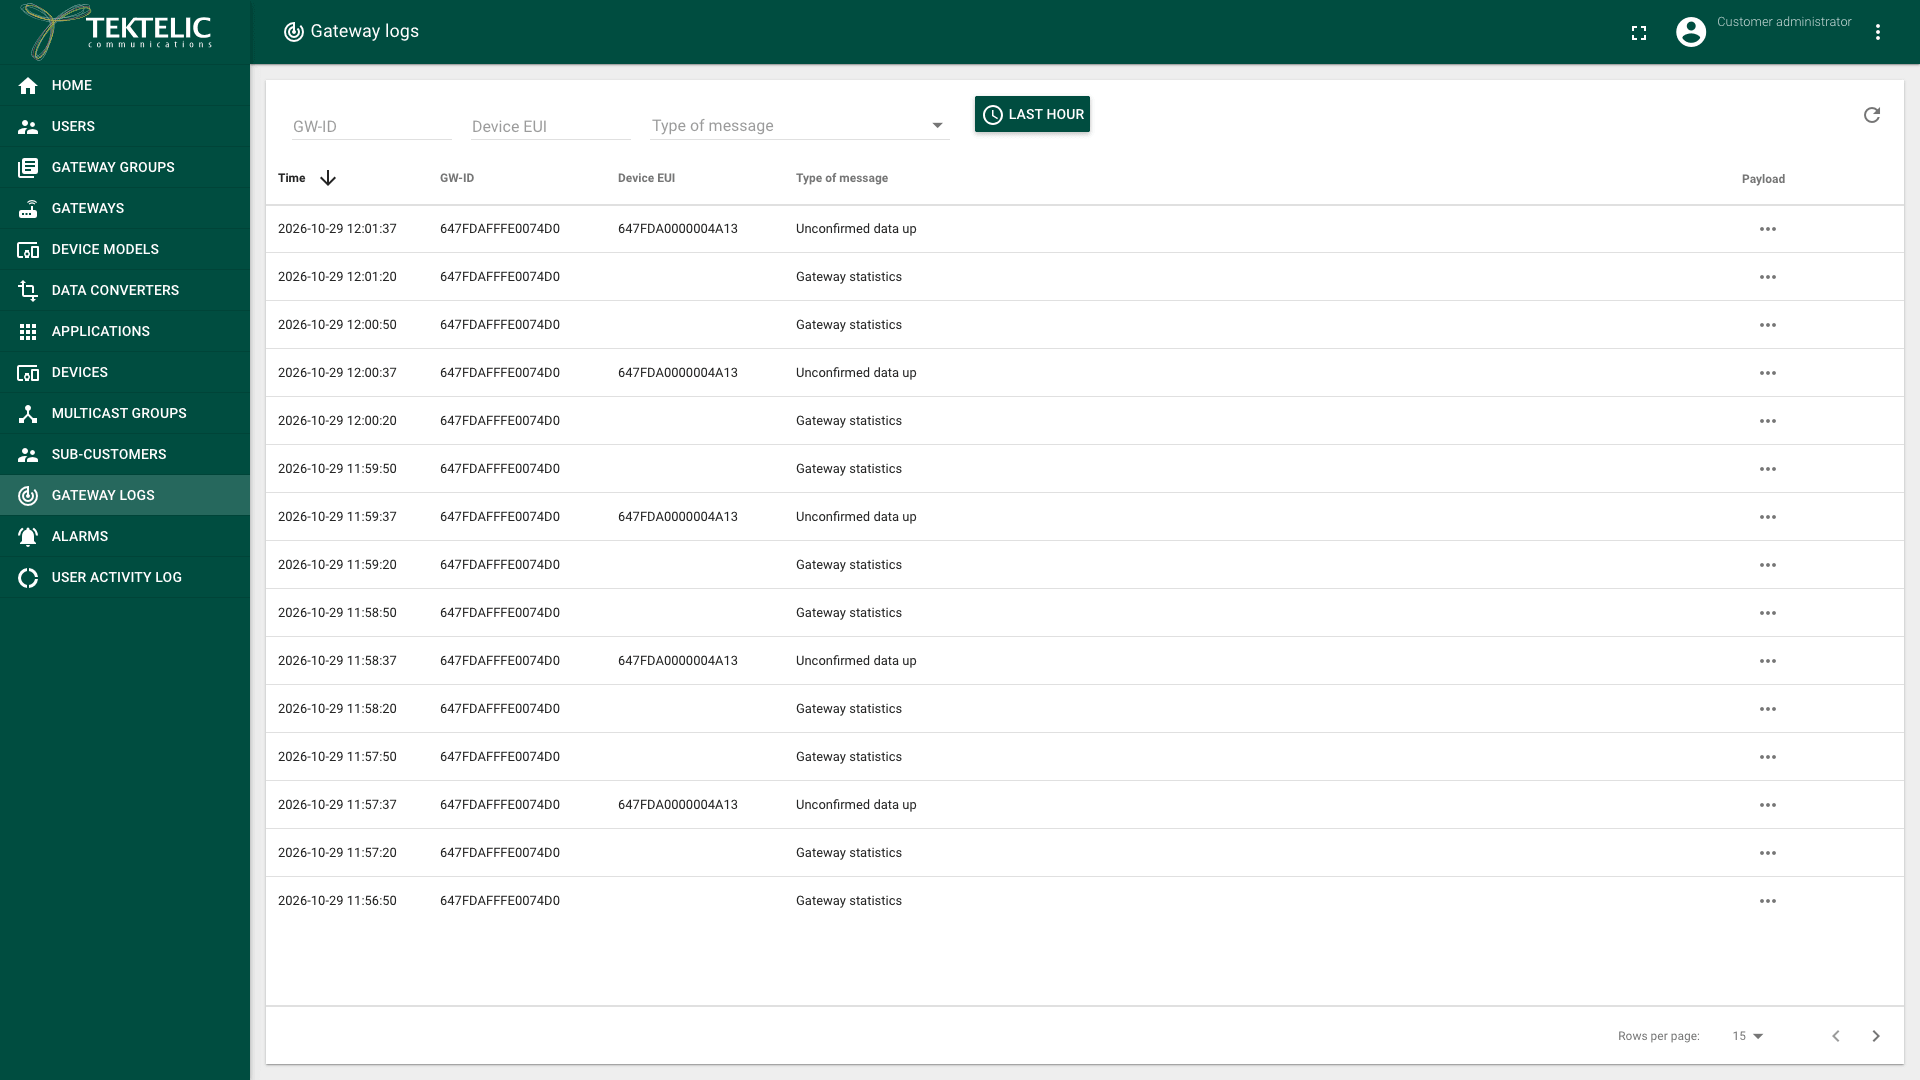
In the side menu, select Gateway logs. The page lists the messages of all your gateways for the LAST HOUR, newest first.
-
To see one gateway, enter its GW-ID in the filter. The list updates when you leave the field.
-
To see the messages of one device, enter its DevEUI in Device EUI.
-
To see only some messages, select one or more types in Type of message. The types are listed below.
-
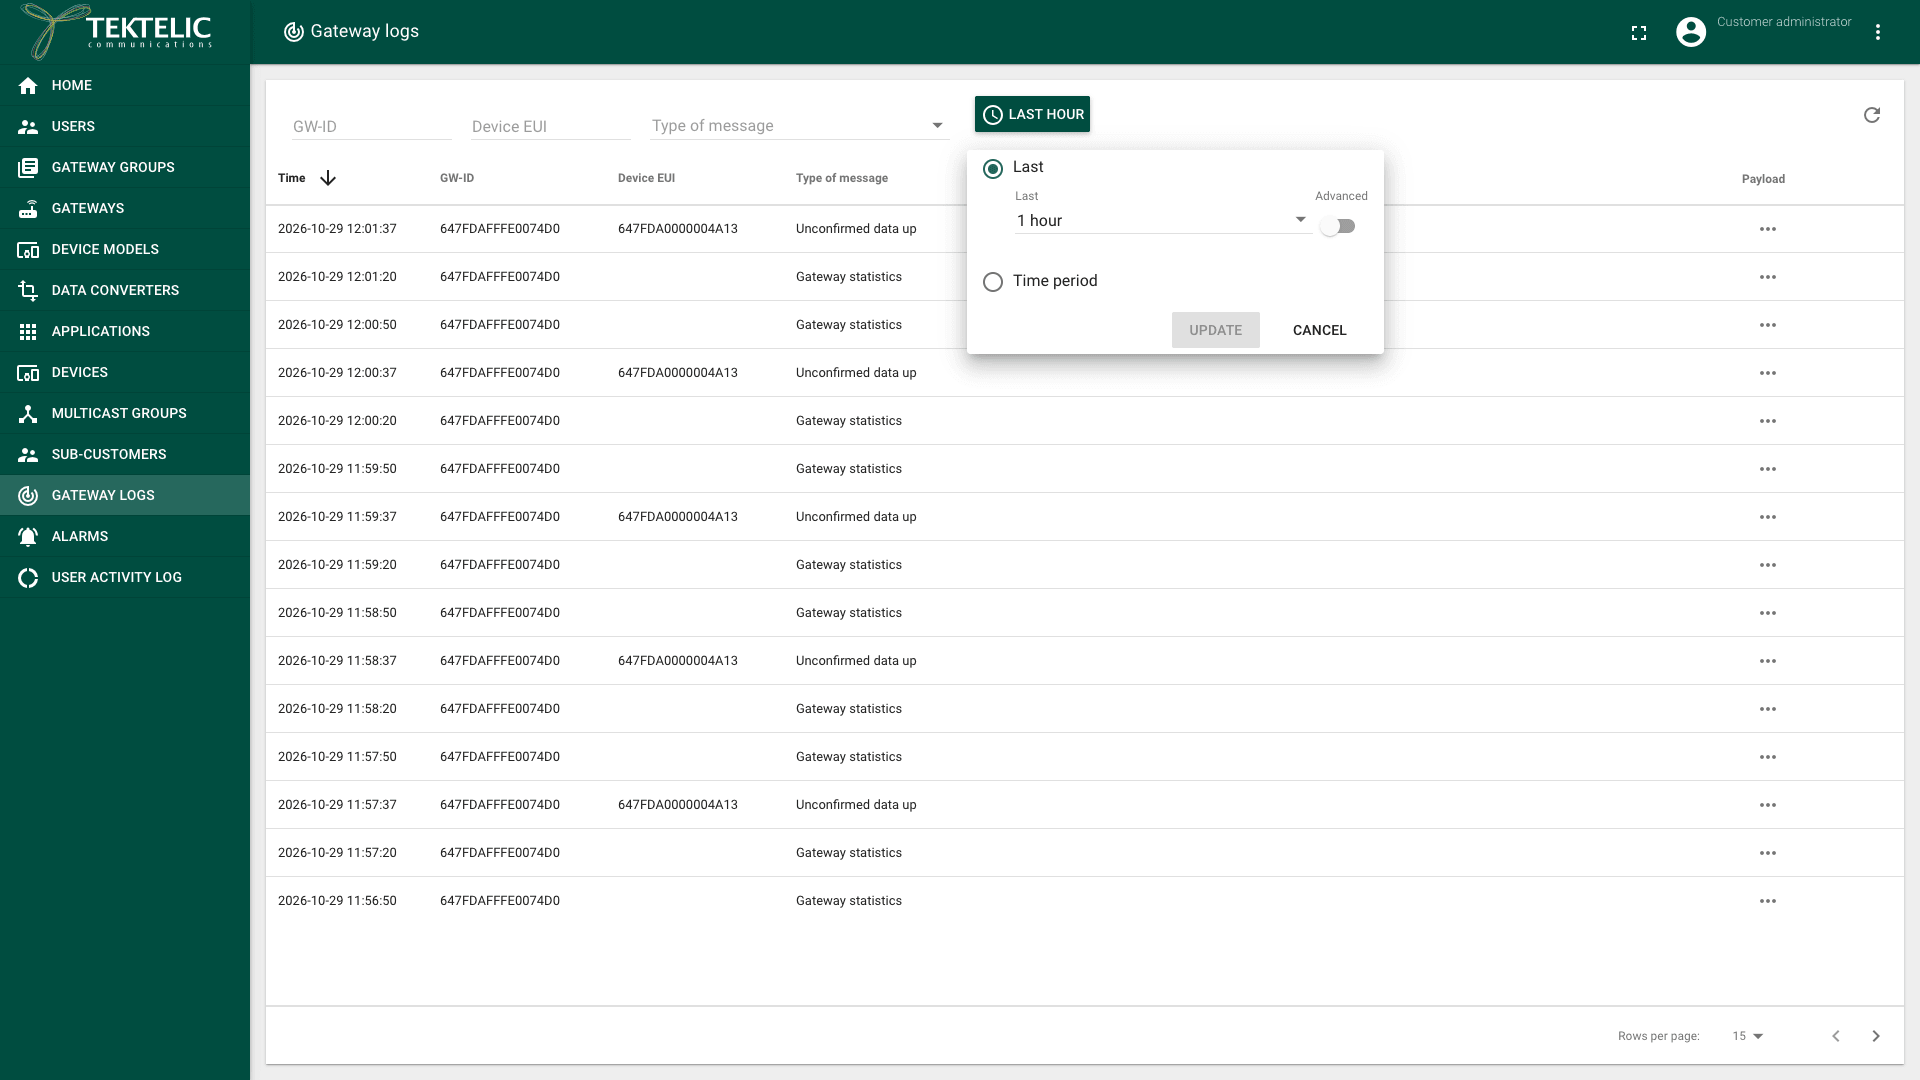
To change the period, select the time window button, for example LAST HOUR. Select Last and pick a duration, or select Time period and set the start and end. Then select Update. A time period can't start more than 24 hours ago.
-
To load new messages, select Refresh.
Each row shows the Time, the GW-ID, the Device EUI for device messages, and the Type of message.
| Type of message | What it records |
|---|---|
| Join request, Join accept | A device's join request and KONA Core's answer. |
| Unconfirmed data up, Confirmed data up | An uplink of a device, received by the gateway. |
| Unconfirmed data down, Confirmed data down | A downlink that KONA Core sent through the gateway. |
| Gateway statistics | A statistics report of the gateway. See Monitor Gateways. |
| Gateway event | An event that the gateway reported. |
| Gateway RPC command, Gateway RPC response | A command sent to the gateway and its answer. See Gateway Commands & Management. |
| Gateway configuration update, Gateway configuration event, Gateway configuration reported | Configuration sent to the gateway, and the configuration the gateway reports. |
| Gateway firmware reported | The firmware version and state the gateway reports. |
confirm the exact meaning of Gateway event and Gateway configuration event.
Read a message
-
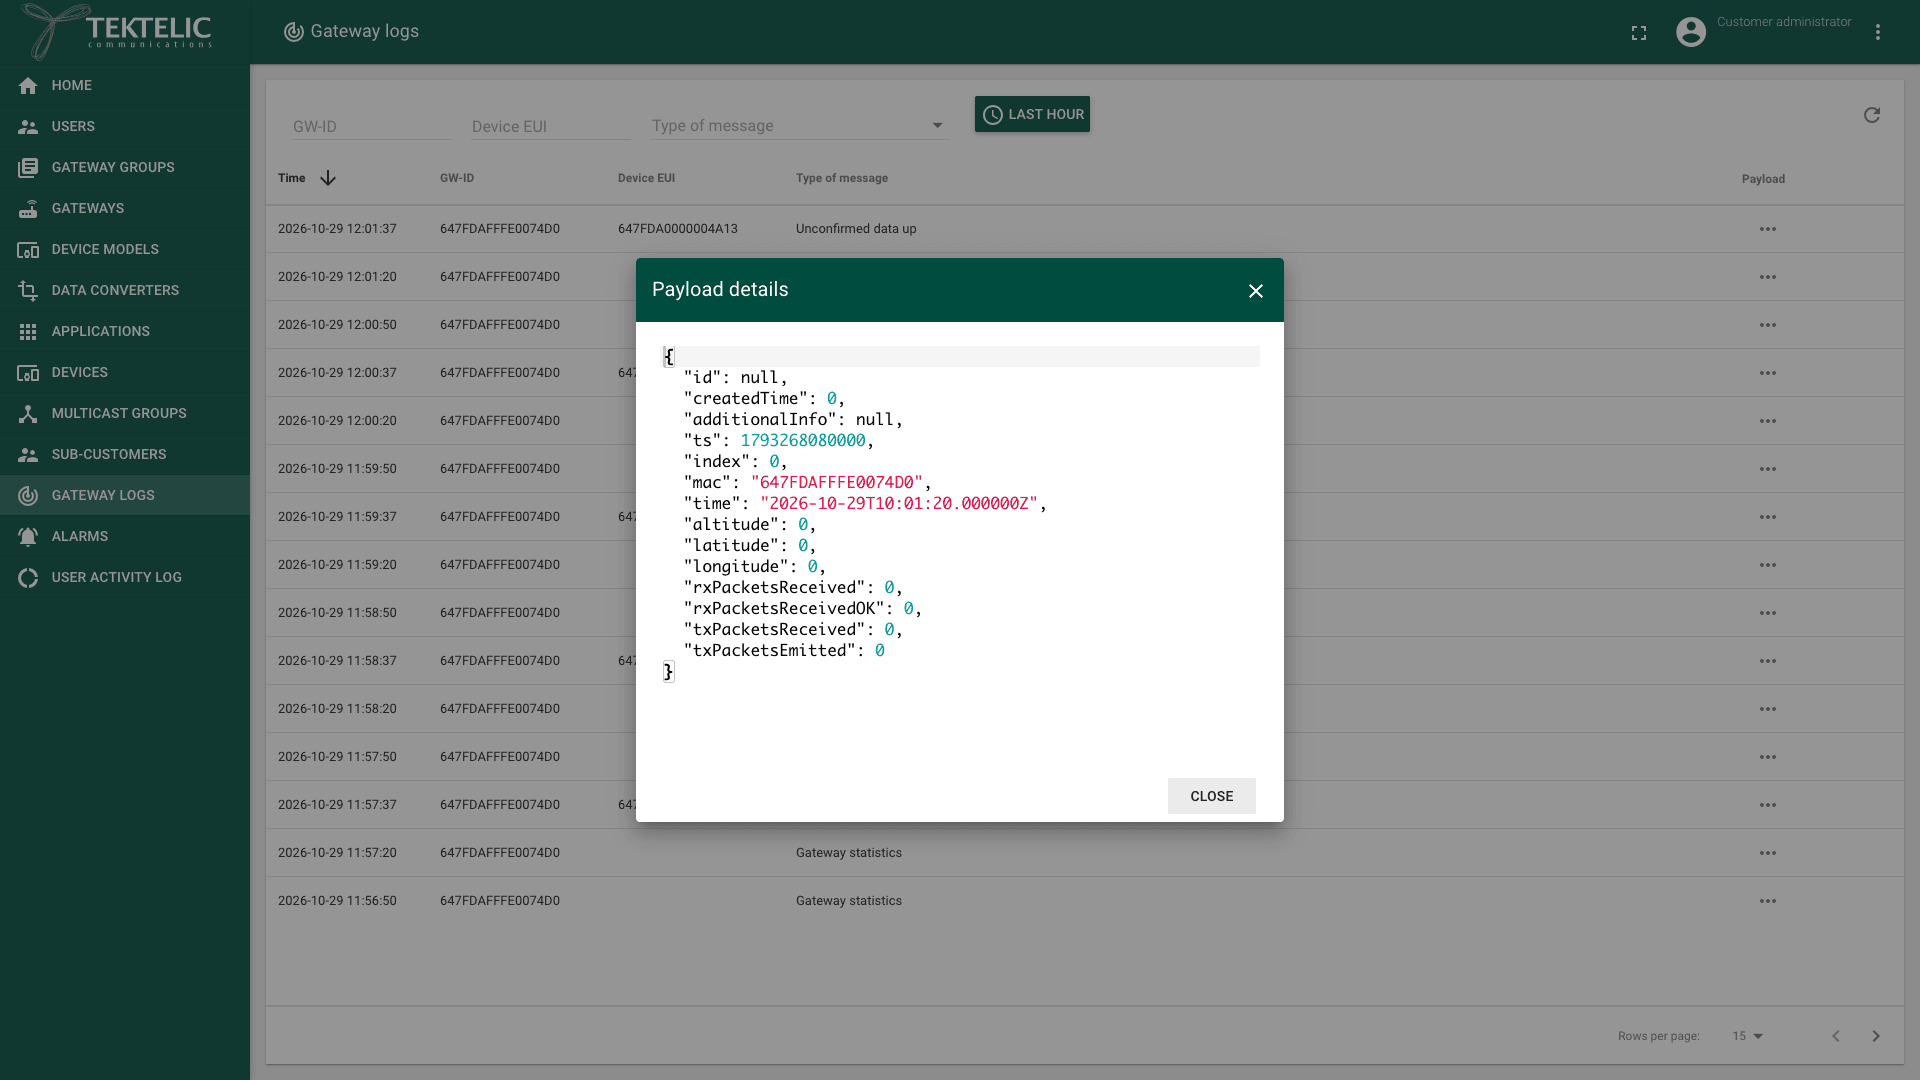
In the row of the message, select Payload details (the ... icon in the Payload column). The Payload details dialog opens. It shows the full message as JSON, for example the counters of a statistics report or the radio metadata of an uplink.
-
Select Close.
Collect logs for support
The Gateway logs page has no export or download button. To send logs to support:
- Filter the page to the gateway, the device and the period of the problem.
- Take a screenshot of the list.
- Open Payload details of each relevant message.
- Select the JSON in the dialog and copy it into your support request.
To download logs as JSON from your own system, use Get gateway logs. It takes the same filters: GW-ID, DevEUI, message types and a start and end time.
Check the result
- The list shows messages of your gateway in the selected period. means that no message matches the filters.
- A gateway that works sends Gateway statistics messages at a regular interval. When devices near the gateway send data, you also see Unconfirmed data up or Confirmed data up messages.
Troubleshooting
| Symptom | Likely cause | What to do |
|---|---|---|
| The page shows . | The filters exclude all messages, or the period is too short. | Clear the filters and select a longer period, up to 24 hours. |
| A gateway's messages never appear. | Logging enabled is cleared for the gateway, or the gateway is offline. | Check the Logging enabled column and the Online status in the gateways list. See Monitor Gateways. |
| Gateway logs is missing from the side menu. | Your role is a Sub-Customer role. | Ask your Customer to check the logs for you. |
Still stuck? A Customer contacts their Provider, and a Provider contacts TEKTELIC Support. Send the GW-ID, the DevEUI if a device is involved, the time in UTC, the copied messages and a screenshot.