Monitor Gateways
Overview
Check that your gateways are connected and forward traffic in TEKTELIC KONA Core Network Server. You read each gateway's status in the gateways list, then its statistics, dashboard and events in the gateway details. At the end, you know which gateways work and which need action.
To get notified when a gateway goes offline instead of checking by hand, add an alarm rule: see Configure Gateway Group Alarm Rules.
Before you start
- Role: any Provider or Customer role. User roles see the same pages read-only. A Sub-Customer has no gateway pages. See Users, Roles & Permissions.
- Gateway: at least one gateway added to KONA Core. See Onboard a KONA Gateway via MQTT.
Steps
Check the status of all gateways
-
In the side menu, select Gateways. The list shows all gateways you can access. To see only the gateways of one gateway group, open the group and select Manage gateways.
-
Read the Online and Activity columns for each gateway.
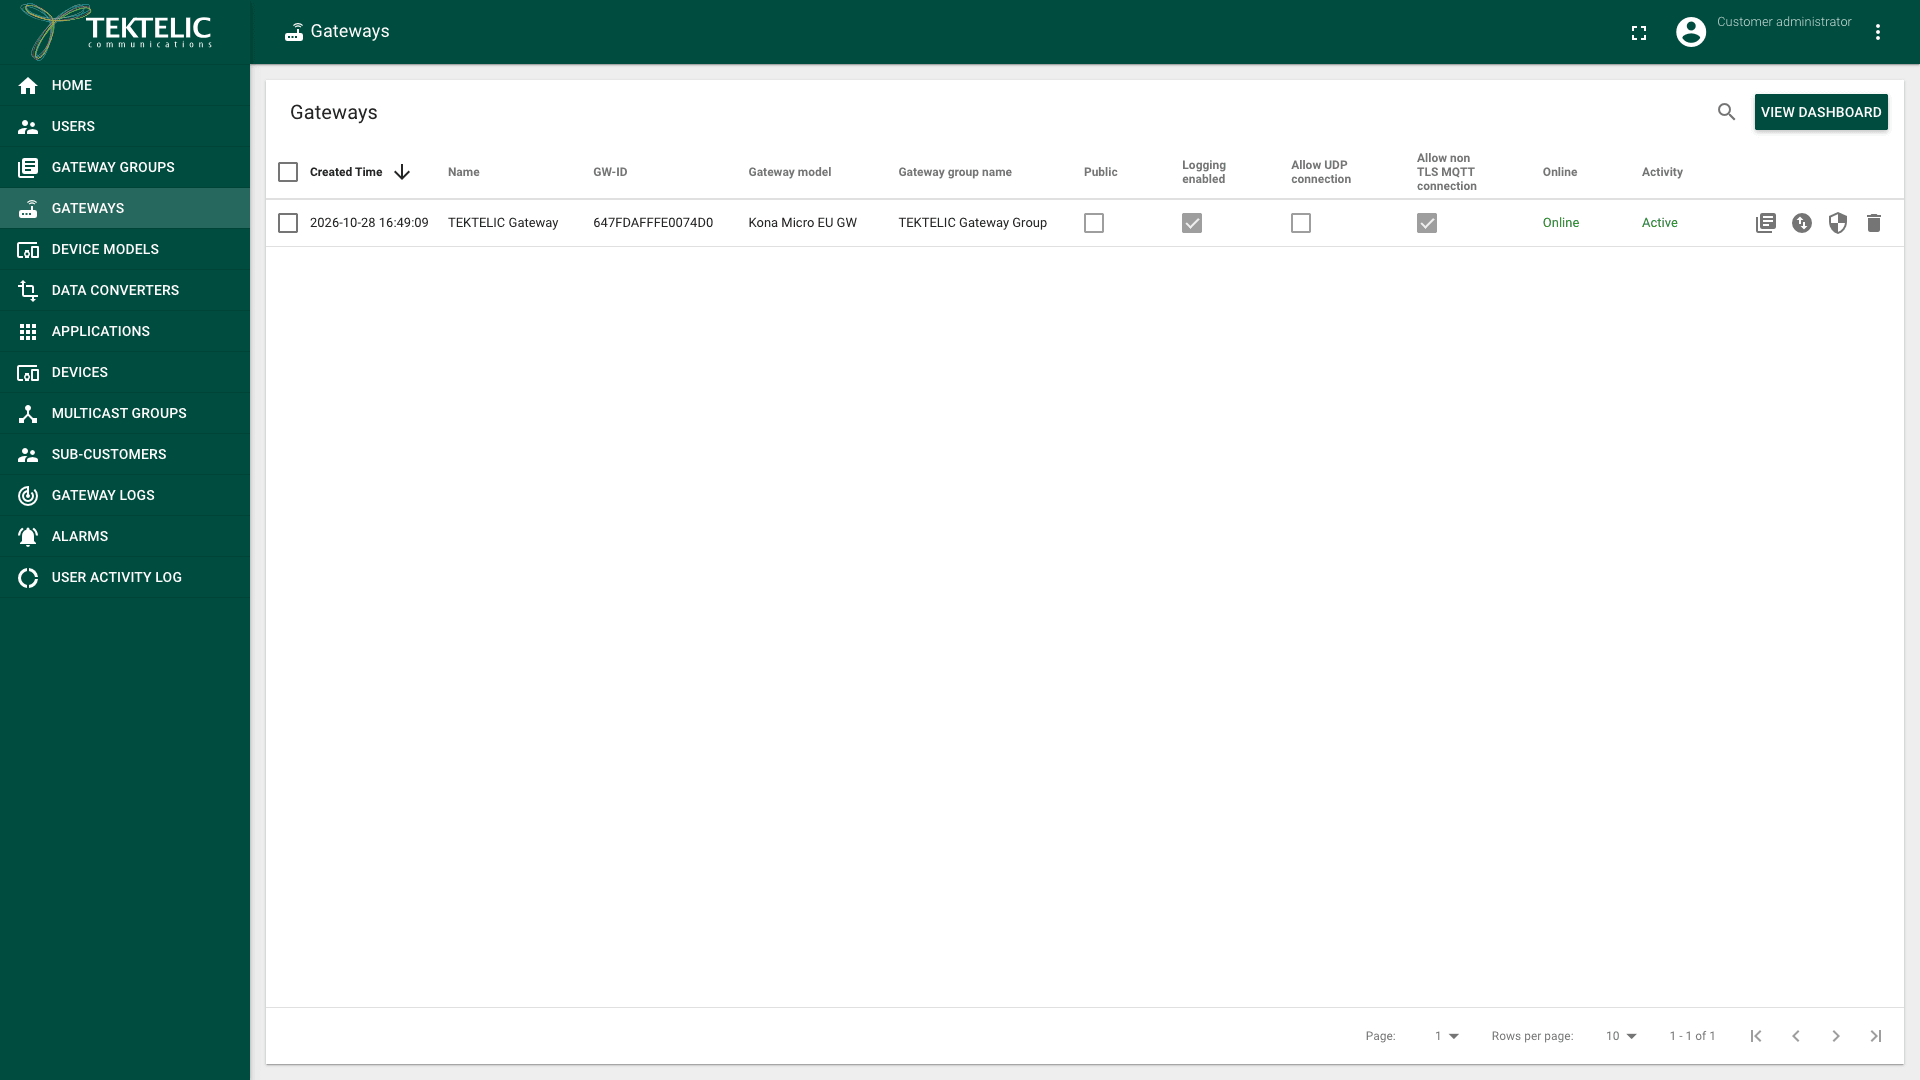
| Column | Value | Meaning |
|---|---|---|
| Online | Online (green) | For MQTT, the connection responds to keep-alive pings. For UDP, gateway statistics arrive within the offline timeout. |
| Online | Offline (red) | The MQTT connection is unresponsive, or UDP statistics haven't arrived before the offline timeout expires. |
| Online | Disabled (red) | An administrator disabled the gateway in KONA Core. |
| Activity | Active (green) | The gateway has transferred data within its configured inactivity timeout. |
| Activity | Inactive (red) | No data was transferred within the configured inactivity timeout. |
A healthy gateway shows Online and Active. A gateway that is Online but Inactive is reachable but hasn't transferred data within its inactivity timeout.
UDP gateways also show Online and Active when they report statistics and forward data. The Online column's tooltip says Status of MQTT connection, but the status also applies to UDP gateways.
The default gateway inactivity timeout is 300 seconds (5 minutes). KONA Core raises an inactivity alarm when that interval passes without data. Offline timeout (sec) also defaults to 300 seconds when empty. For MQTT, Online monitors the connection's keep-alive pings; for UDP, it monitors gateway statistics.
Read the details of one gateway
-
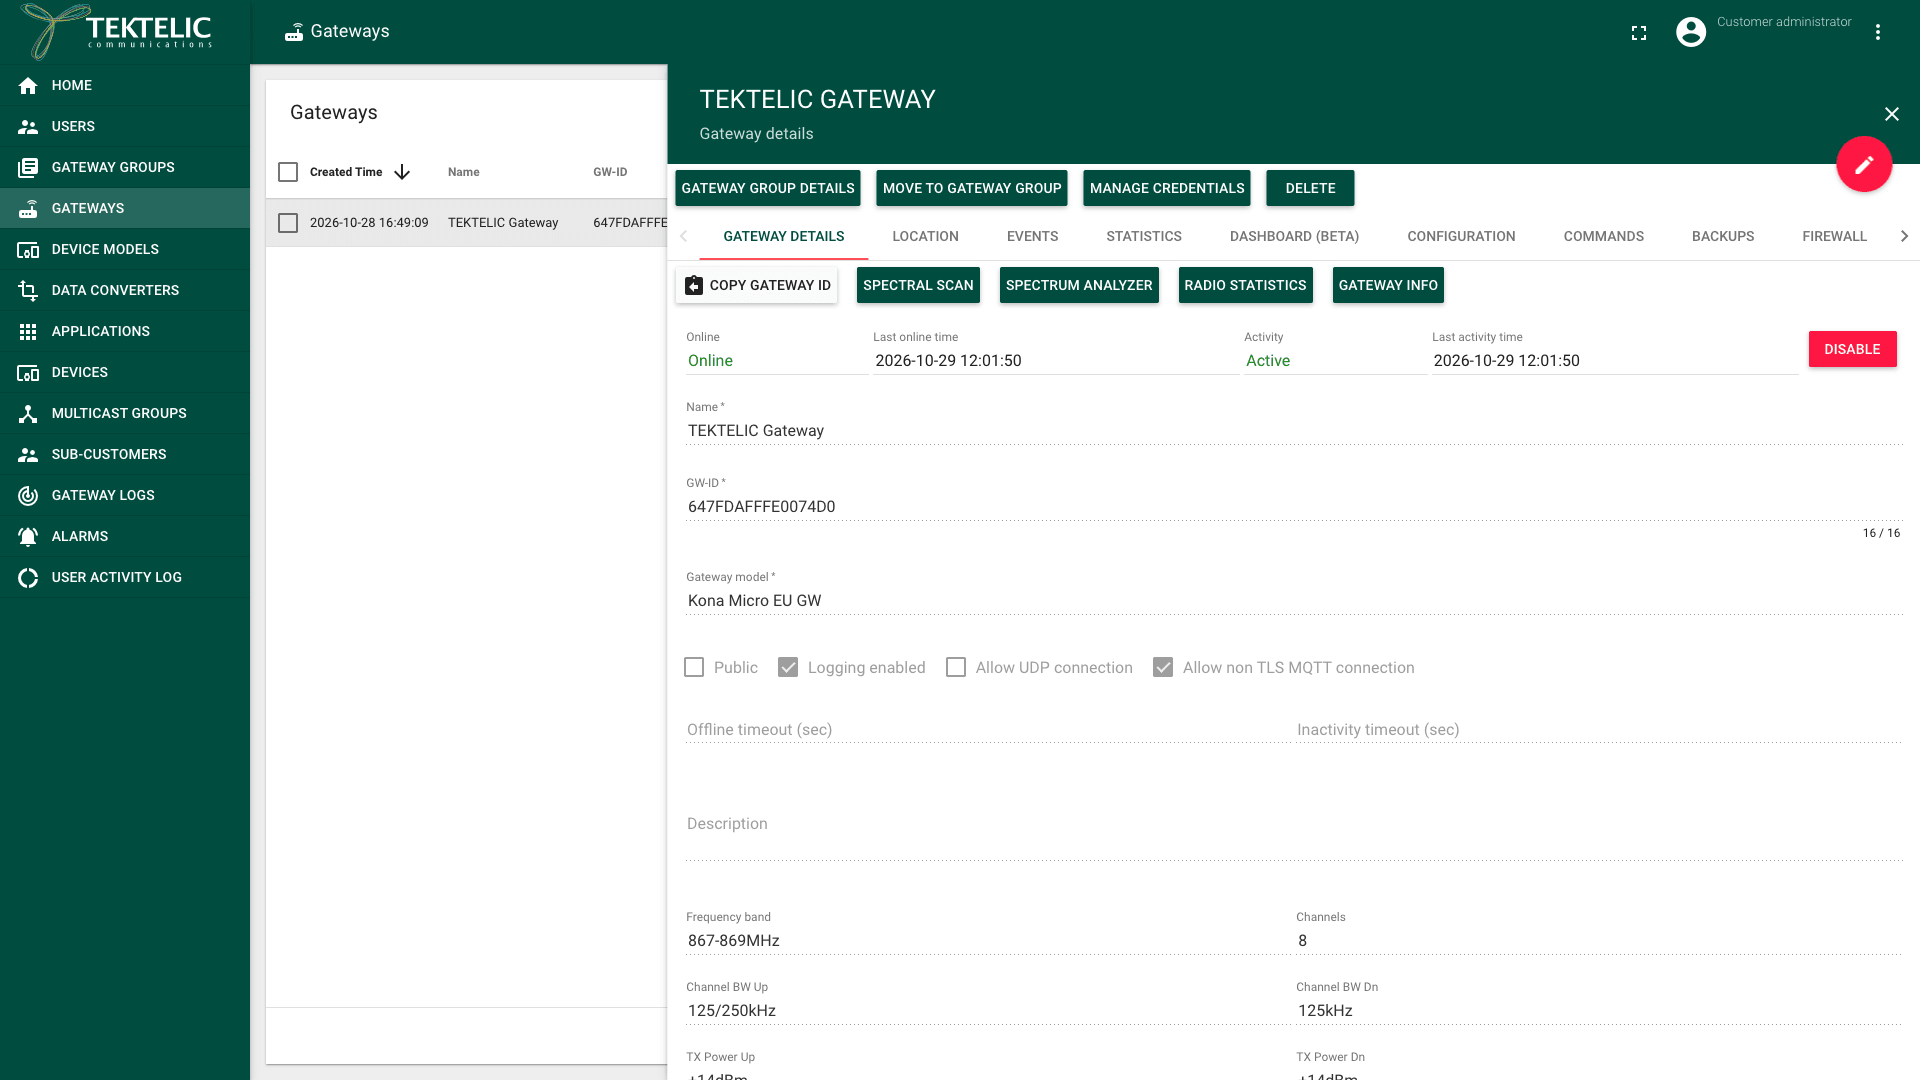
Select the gateway in the list. The Gateway details panel opens on the Gateway details tab.
-
Read the status fields at the top:
- Online and Last online time: the gateway's online status and the last time it was online.
- Activity and Last activity time: the status of data transfer, and when the gateway last sent data.
Read the gateway statistics
-
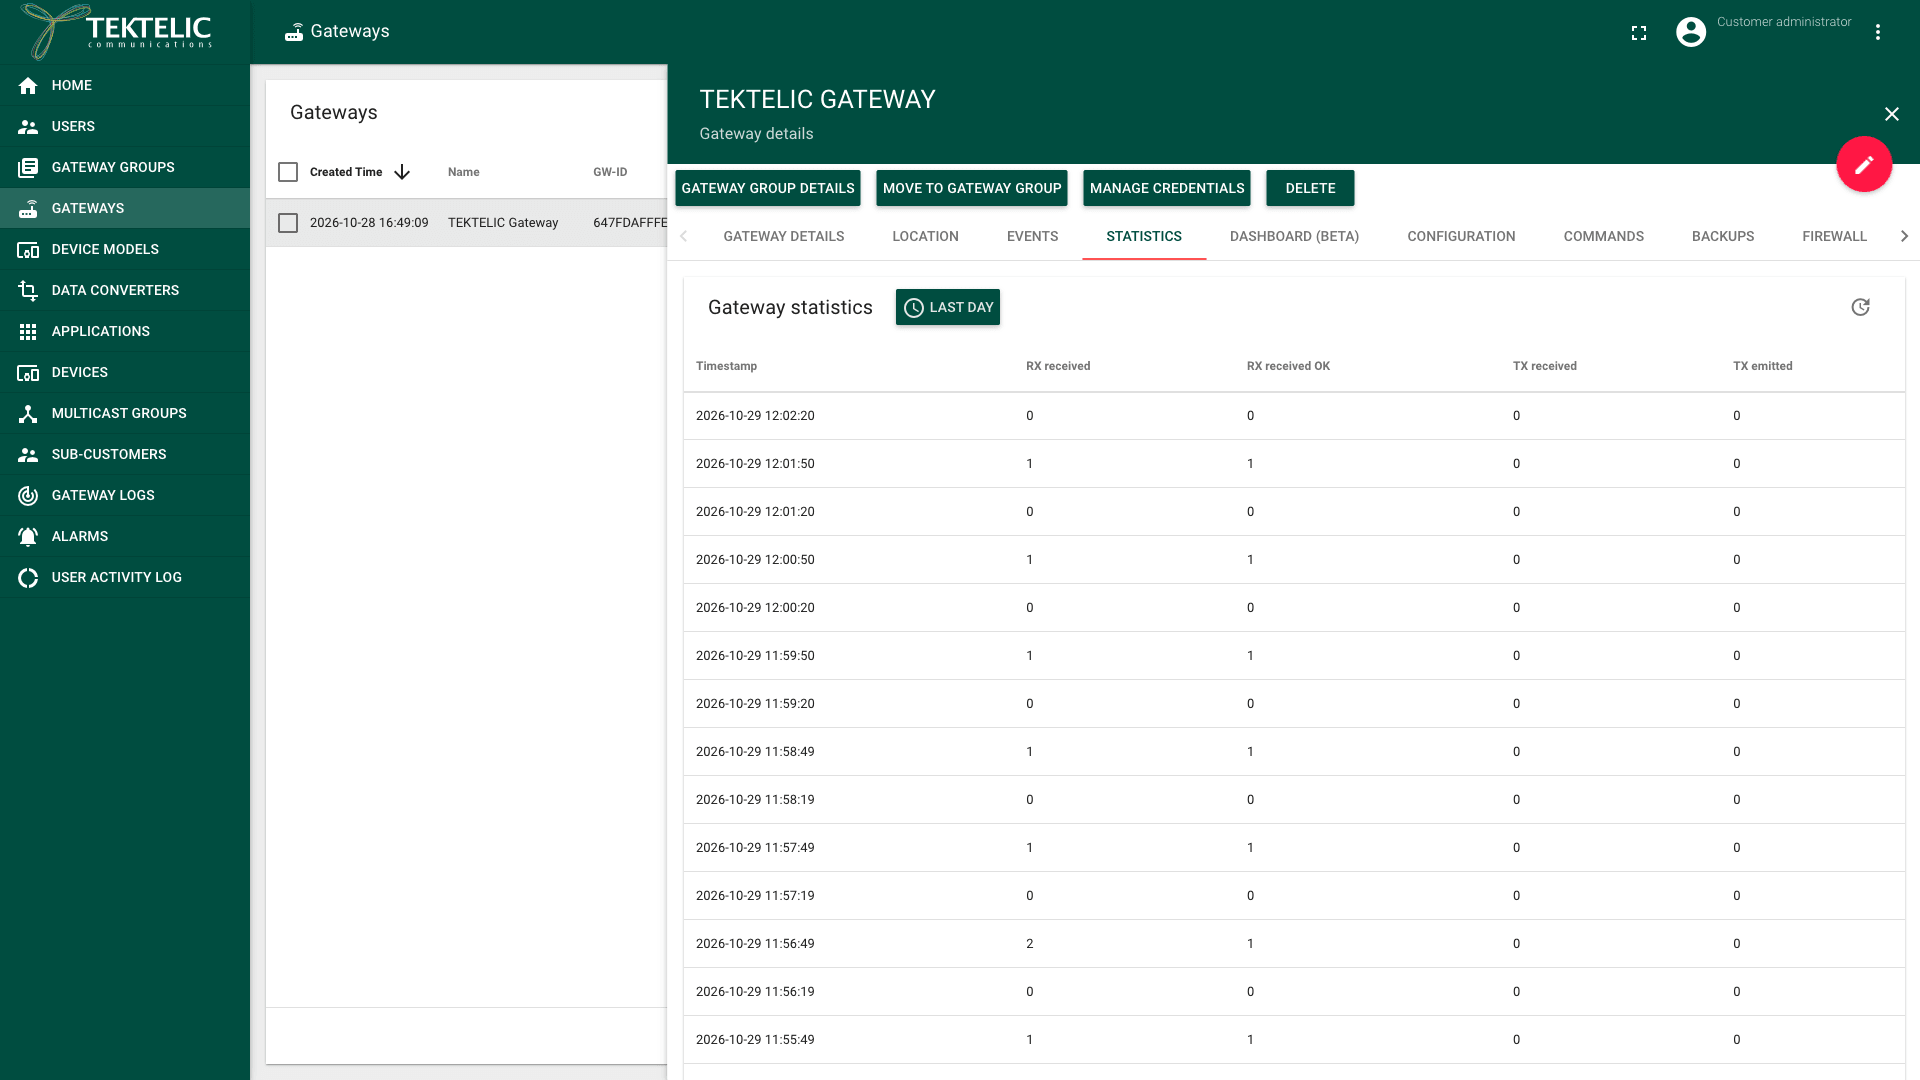
In the Gateway details panel, select the Statistics tab. The Gateway statistics table shows one row for each statistics report of the gateway, newest first. The default time window is LAST DAY.
-
Read the counters of each report:
Column Meaning Timestamp When the gateway sent the report. RX received Packets the gateway received over the air. RX received OK Received packets with a valid CRC. TX received Downlinks the gateway received from KONA Core for transmission. TX emitted Downlinks the gateway transmitted over the air. Each row counts packets since the previous statistics report.
-
To pick another period, select the time window button, for example LAST DAY.
-
To stop new rows from moving the table while you read it, select Pause statistics update. New reports are counted as new statistics available. Select Start statistics update to show them.
Gateways send a statistics report every 30 seconds. Gateway-side changes to the reporting interval are outside this guide's scope.
How to read the values:
- Reports arrive regularly: a gap in the timestamps means the gateway was offline or didn't report.
- RX received OK is close to RX received: when a large share of received packets fails the CRC check over several hours, check the gateway's antenna and the radio environment. A Spectral Scan on the Gateway details tab shows interference. See Gateway Commands & Management.
- TX emitted is lower than TX received: possible causes include duty cycle restrictions, radio unavailability, scheduling conflicts, invalid transmission parameters or hardware and software issues. Check the gateway's transmit settings and logs.
- Zeros are not an error: a gateway with few devices reports 0 in many rows.
View the dashboard
The Dashboard (Beta) tab of a gateway shows its performance as charts. On the Gateways page, View Dashboard opens the same kind of dashboard for one or more gateway groups: select the groups in Select Gateway Groups. Both appear only when the dashboard feature is enabled in your KONA Core.
confirm the widgets of the gateway dashboard, what each one shows, and which values are normal.
Dashboard (Beta) tab of a gateway. Opening the dashboard sends a write request, which the read-only screenshot tool blocks.
Check the gateway's events
-
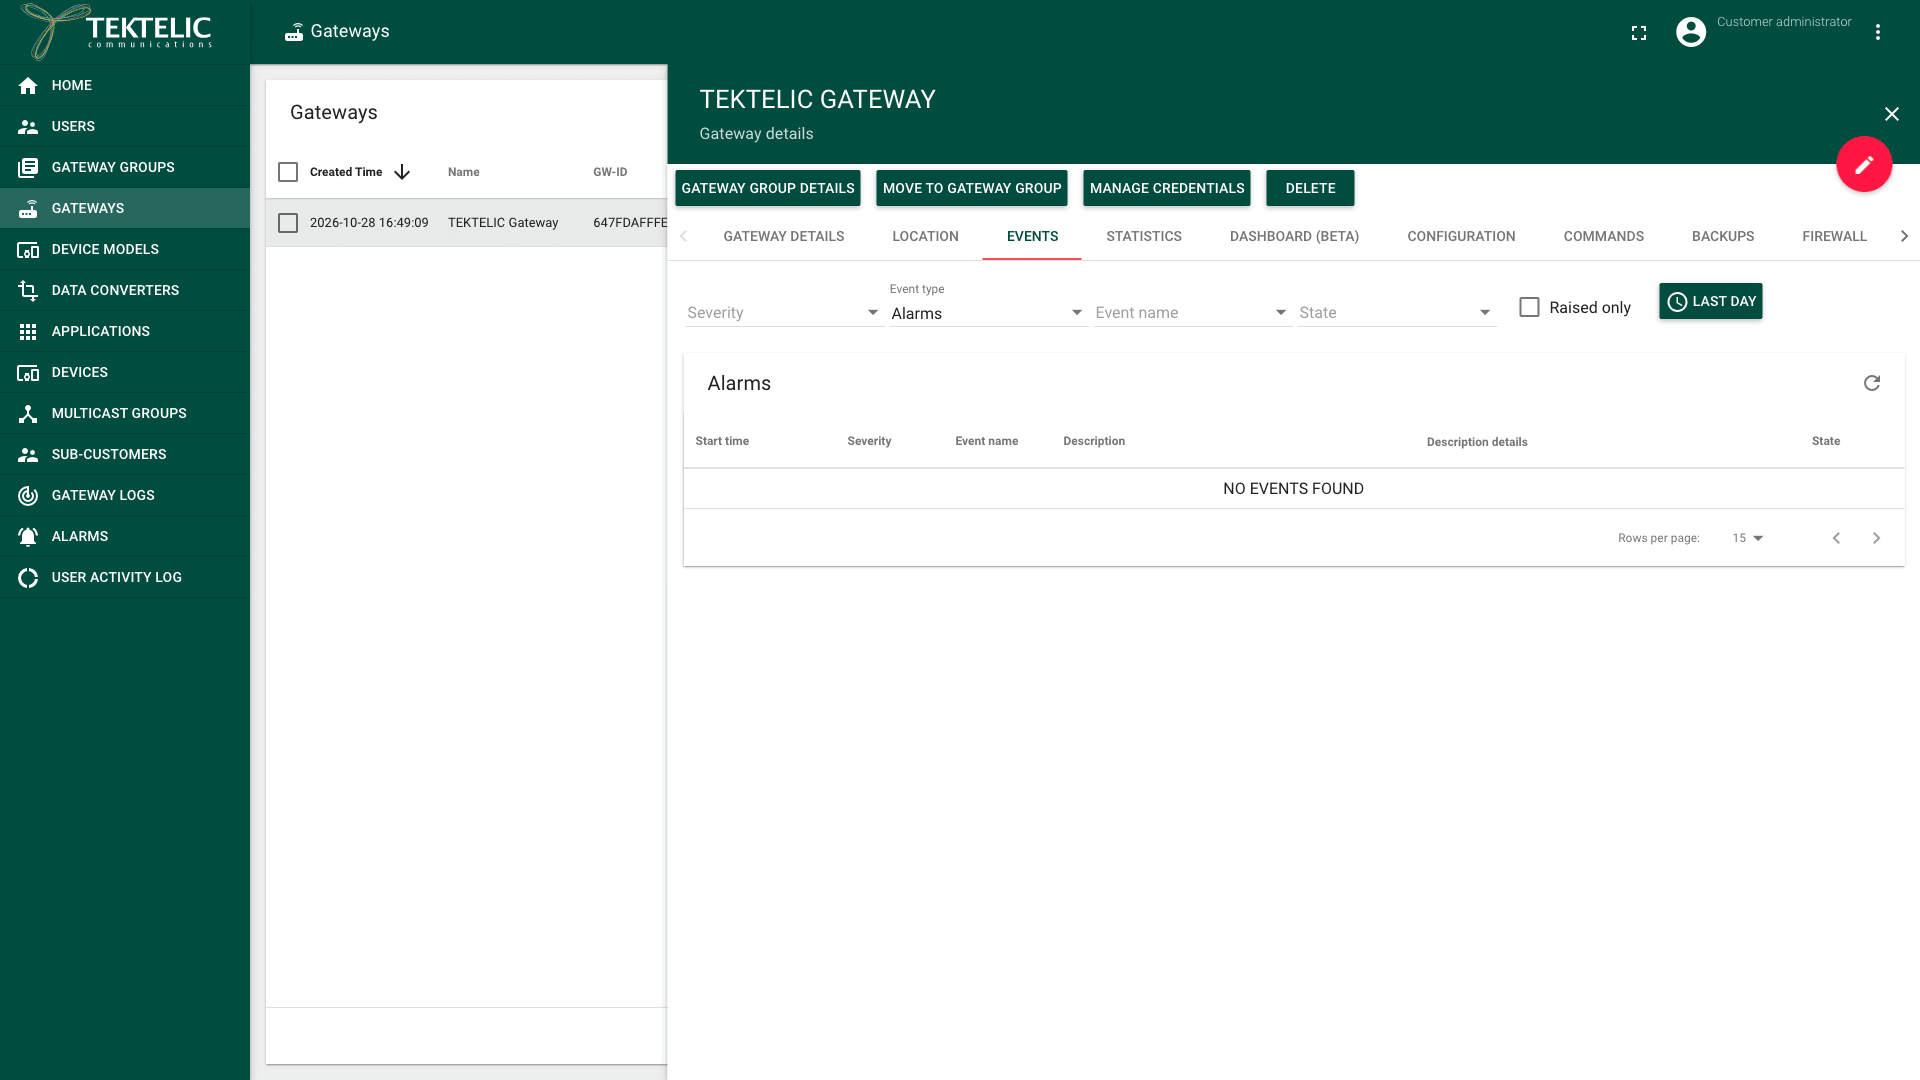
In the Gateway details panel, select the Events tab. The tab opens with Event type set to Alarms, Raised only cleared and the time window LAST DAY.
-
Read the list. Each event shows its Start time, Severity, Event name, Description, Description details and State. means that the gateway had no alarm in the time window.
-
To see only the alarms that are still raised, select Raised only. To see more, filter by Severity, Event type, Event name or State, or select a longer time window.
For how events and alarms work, see Events & Alarms. For every event name, see Alarms & Events Reference.
Check the result
Your gateway is healthy when all of these are true:
- The gateways list shows Online and Active, for either MQTT or UDP.
- Last activity time on the Gateway details tab is recent.
- The Statistics tab shows a new report at a regular interval, with RX received OK close to RX received.
- The Events tab, with Raised only selected, shows : the gateway has no raised alarm.
To read the status from your own system, use Get gateway online state, Get gateway activity state and Get gateway stats.
Troubleshooting
| Symptom | Likely cause | What to do |
|---|---|---|
| The gateway shows Offline. | The MQTT connection is unresponsive, or UDP statistics stopped arriving. The gateway may have lost power or internet access. | Check power and network access. For MQTT, check GATEWAY_AUTHENTICATION_ERROR and GATEWAY_MQTT_CONNECTION_LOST on Events. For UDP, check statistics reporting. See MQTT onboarding or UDP onboarding. |
| The gateway shows Online but Inactive. | No device is sending near the gateway, or the gateway's radio doesn't forward packets. | Check that the devices are on and use the gateway's frequency plan. Check RX received on the Statistics tab. In Gateway Logs, look for uplink messages from the gateway. |
| The Statistics tab shows no new rows. | The gateway is offline, or it doesn't send statistics reports. | Check the Online status. Check the gateway's configuration: see Configure Gateways. |
Still stuck? A Customer contacts their Provider, and a Provider contacts TEKTELIC Support. Send the GW-ID, the time in UTC when the problem started, the exact event name or message and a screenshot.