Work with Alarms
Overview
Find the alarms of your LoRaWAN® network in TEKTELIC KONA Core Network Server, filter them and read their details. You see which gateways, devices and integrations have a problem now, and how severe it is. You can also look back at cleared alarms and export the list to a CSV file.
KONA Core raises and clears alarms by itself. An alarm has no acknowledged state, and you can't clear it by hand: it clears when its condition ends. For how alarms work, see Events & Alarms.
Before you start
- Role: any Provider, Customer or Sub-Customer role. System roles have no Alarms page. See Users, Roles & Permissions.
- What you see: only events for entities within your permissions. Events of higher-level or unrelated tenants aren't visible.
Steps
Open the alarm list
-
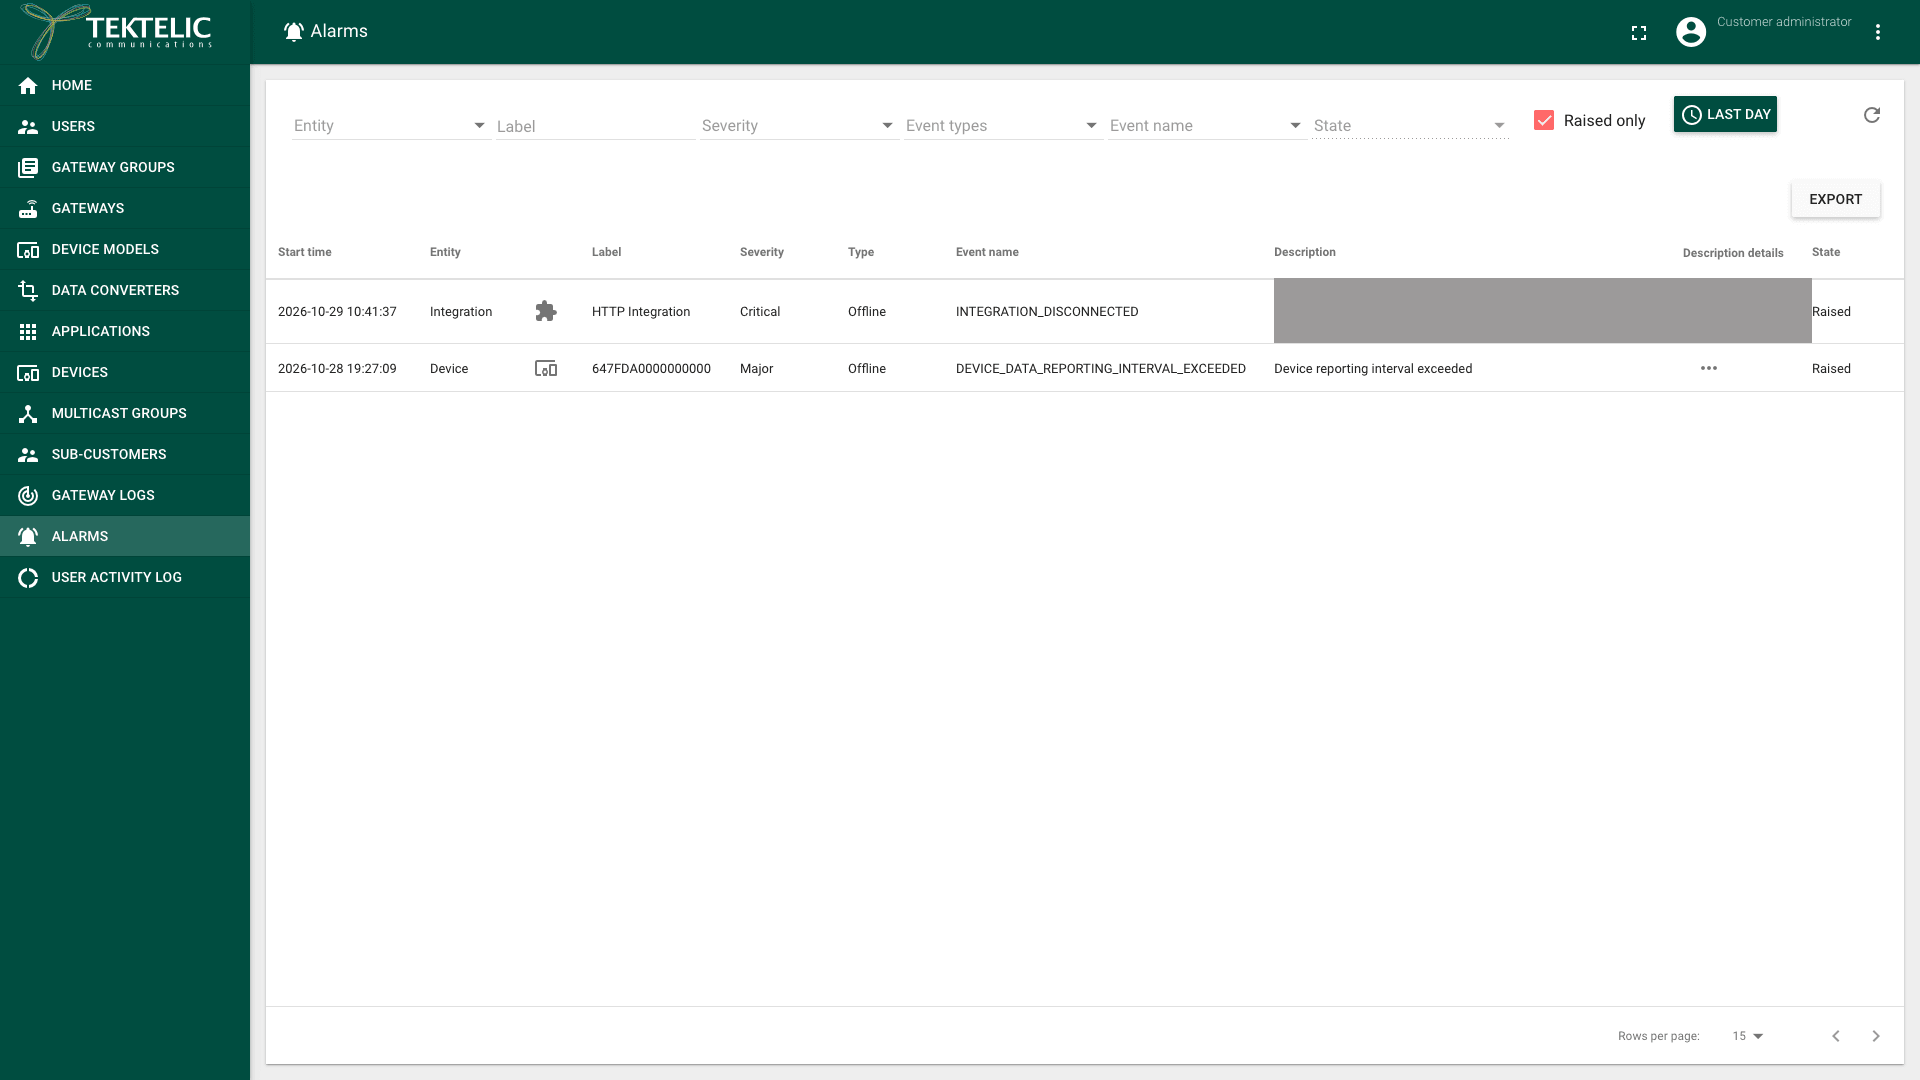
In the side menu, select Alarms. The Alarms page opens. Raised only is selected, so the list shows only the alarms that are raised now. The time window is LAST DAY.
-
Read the columns of each row:
Column What it shows Start time When KONA Core recorded the event. Entity The source: Gateway, Device or Integration. Label The name or ID of that gateway, device or integration. Severity Critical, Major or Minor. Type Alarm, Fault, Offline or Event. Event name A fixed code, for example DEVICE_DATA_REPORTING_INTERVAL_EXCEEDED.Description What happened, shortened in the list. Description details The full description, behind the … (more) icon. State Raised or Clear. For the meaning of each event name and what to do, see Alarms & Events Reference.
Read the severity
Each alarm comes with its severity. You don't set it, and an alarm rule doesn't change it. Work through the list from Critical to Minor:
| Severity | How to treat it |
|---|---|
| Critical | Act now. Data likely doesn't reach your system, for example when an integration is disconnected. |
| Major | Act soon. A gateway, device or integration doesn't work as expected, for example a device that stops reporting. |
| Minor | Check when convenient. |
Filter the list
- In Entity, select one or more of Gateway, Device and Integration.
- In Label, enter the name or ID of a gateway, device or integration. confirm whether Label matches part of a name or only the full name.
- In Severity, select one or more of Critical, Major and Minor. We recommend starting with Critical.
- In Event types, select one or more of Alarms, Faults, Events and Offline.
- In Event name, select one or more event names, for example
GATEWAY_MQTT_CONNECTION_LOST. - In State, select Raised, Clear or both. confirm how the State filter works while Raised only is selected.
- To reload the list, select Refresh (the circular arrow icon).
See cleared alarms and older events
-
Clear Raised only. The list now shows the history: raised and cleared alarms, and events of the type Events.
-
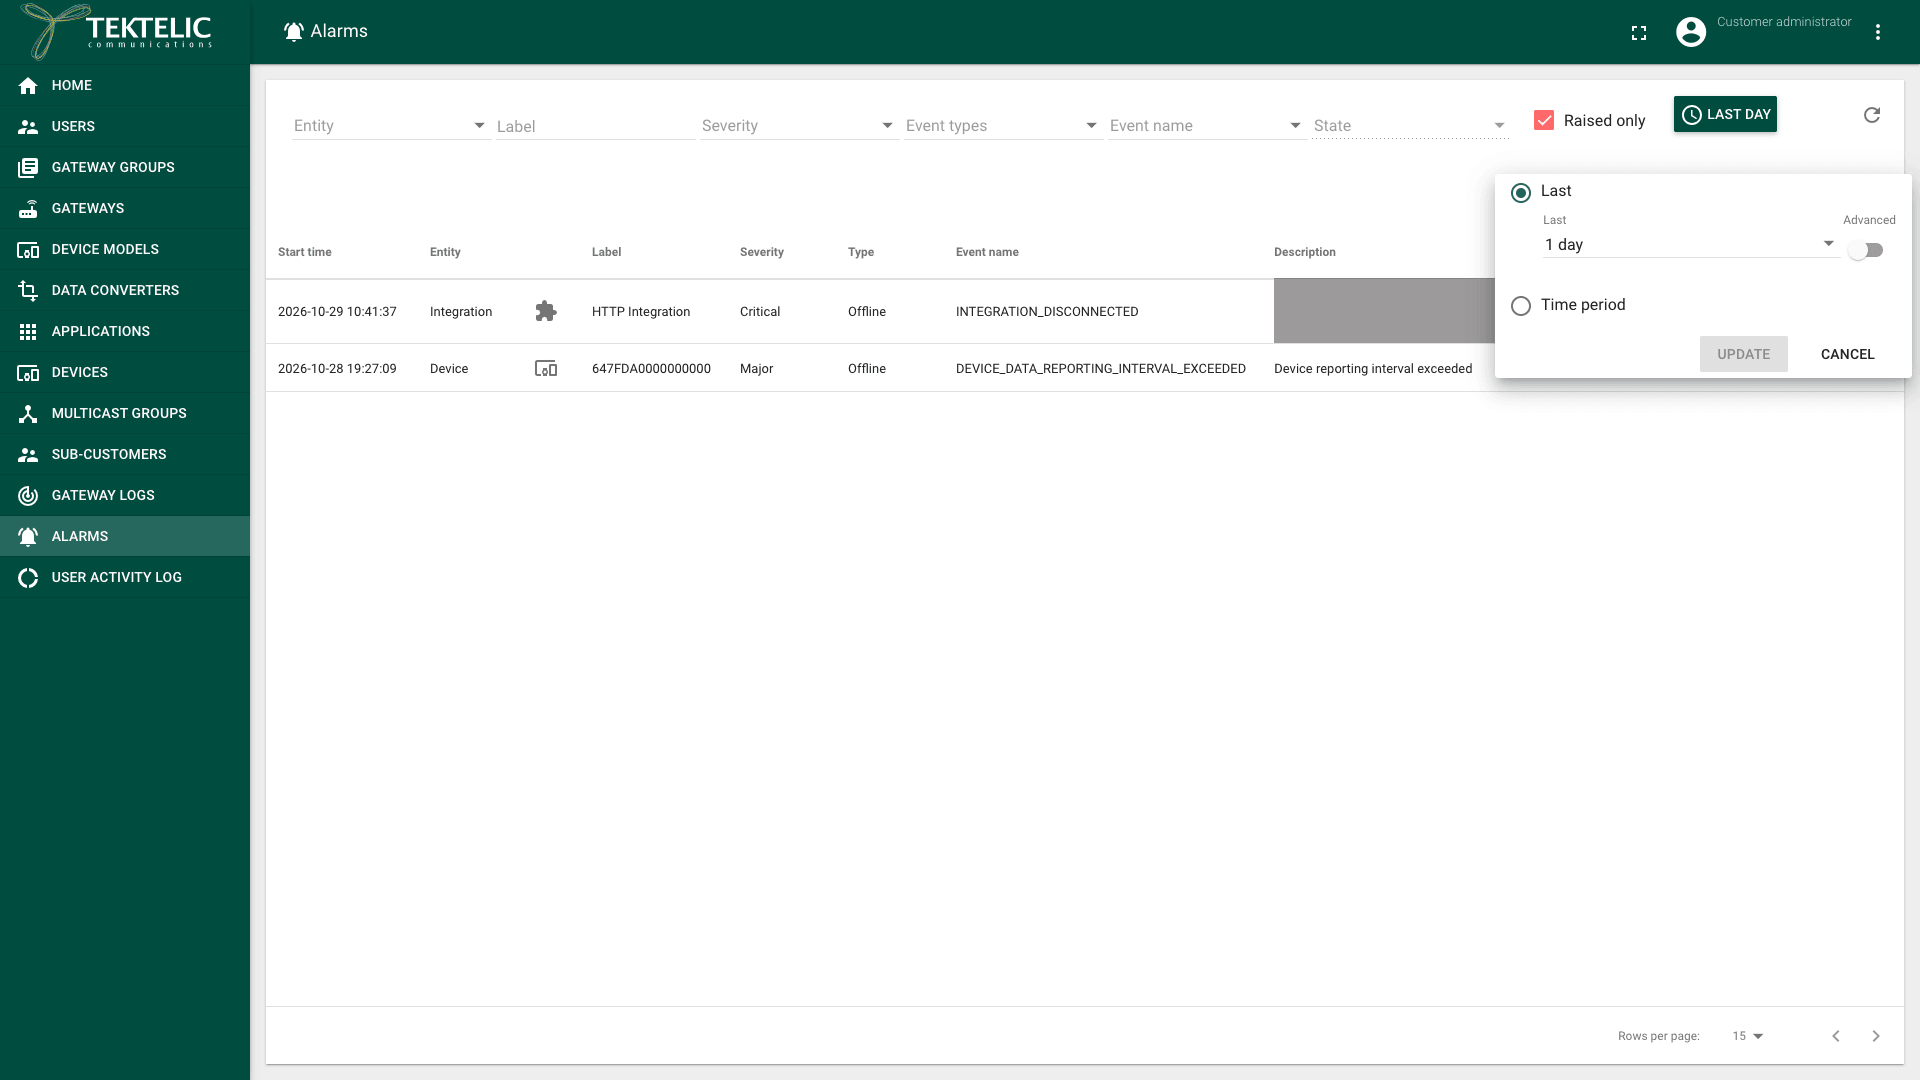
Select LAST DAY. The time window panel opens.
-
Choose the period:
- Last: select a duration from 1 second to 30 days, for example 7 days.
- Time period: set the start and the end of the period.
-
Select UPDATE. The list shows the events of the new period. To close the panel without a change, select CANCEL.
Read the details of an alarm
-
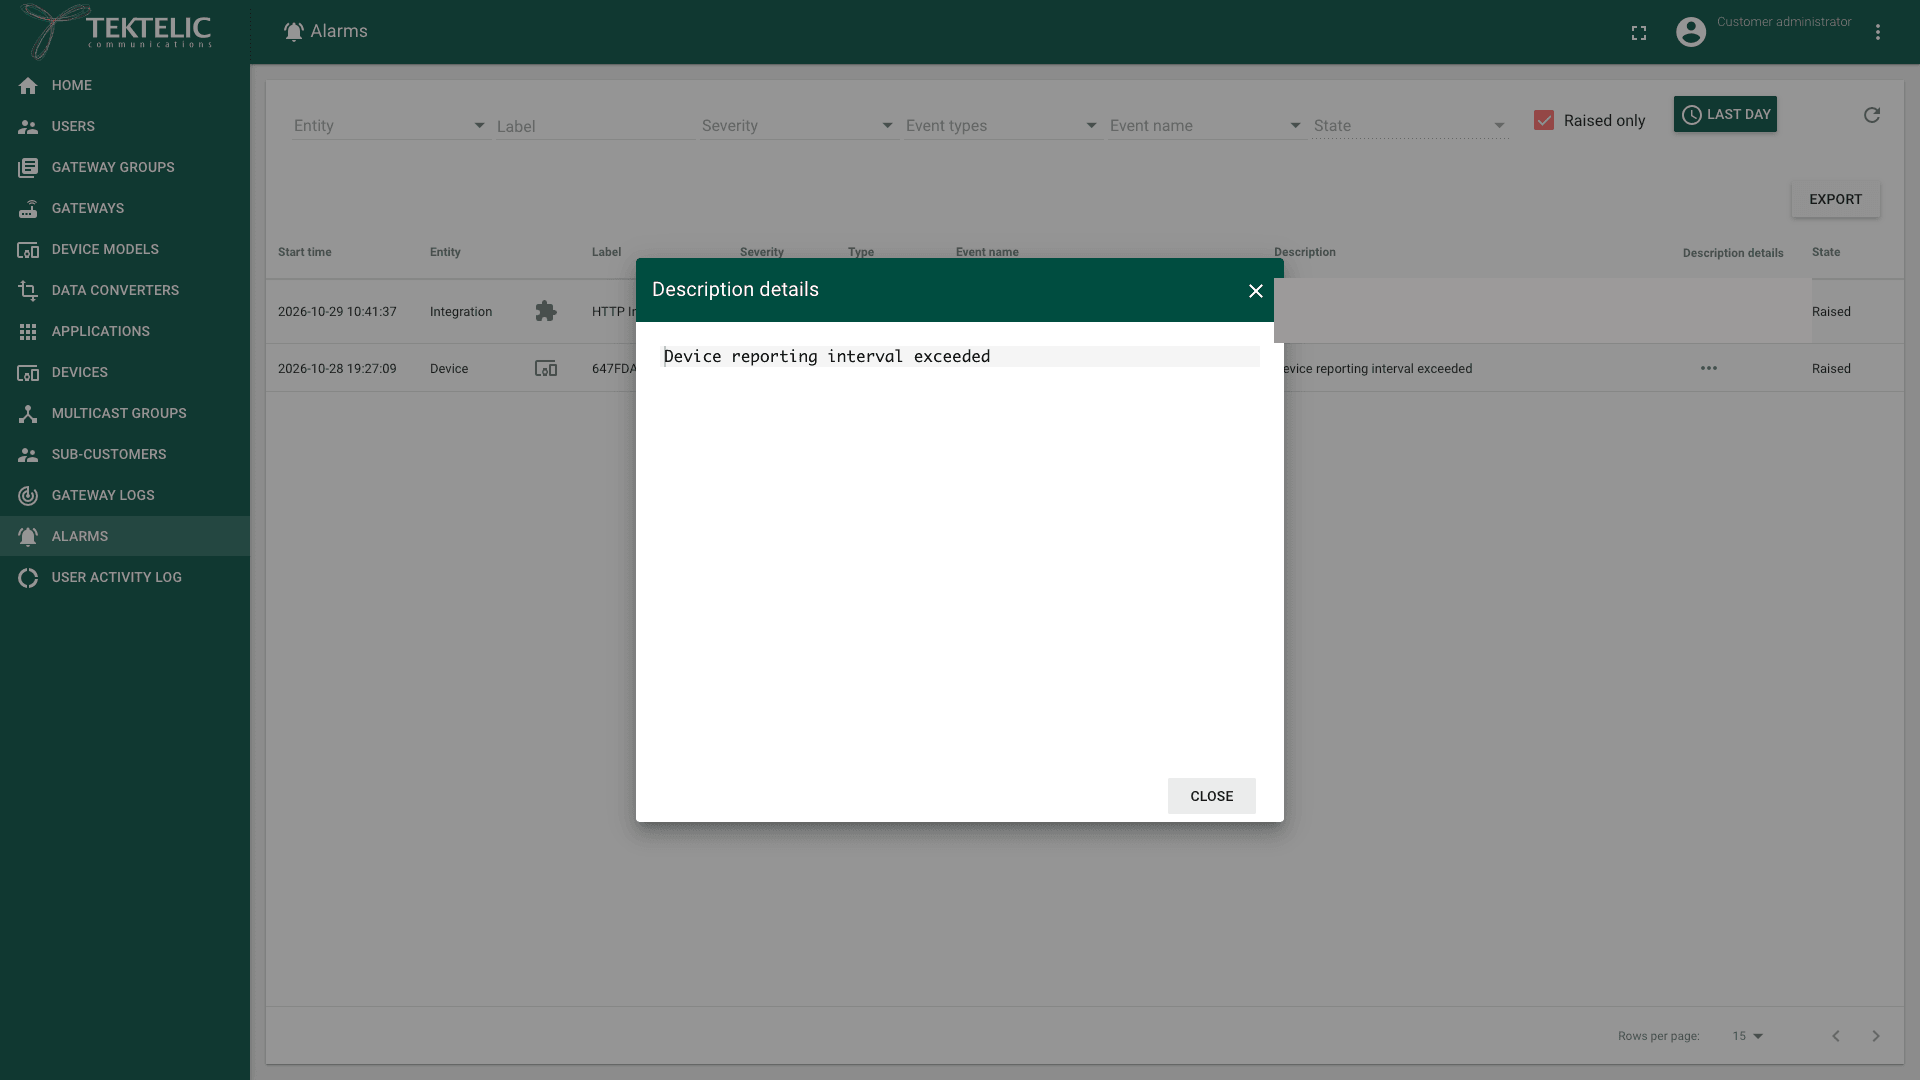
In the alarm's row, select the … (more) icon in Description details. The Description details dialog opens with the full text. For some events, it includes the cause and the payload involved.
-
Select CLOSE.
-
To open the gateway, device or integration itself, select the icon next to Entity in the alarm's row. Its details panel opens only if your permissions include that entity.
Acknowledge or clear an alarm
KONA Core has no acknowledge or manual clear. Neither the Alarms page nor the API offers one. To clear an alarm, fix its cause:
- Find the cause in Event name and Description details.
- Fix it, for example reconnect the gateway or correct the integration's address.
- Wait for KONA Core to detect the fix. It adds a new Clear record. Clear Raised only to include that record in the history.
To track who handles an alarm, use your own ticket system. To start a ticket from an alarm, send its notification there: see Alarm Notifications.
Export the list
- Set the filters, Raised only and the time window for the alarms you need.
- Select EXPORT. KONA Core saves the list as a CSV file named
<date>_alarms.csv, with semicolons between the values. The file has the columns of the list and the full description details. While the export runs, the button shows CANCEL and the number of rows fetched.
If the list is empty, EXPORT is unavailable and shows
Check the result
- With Raised only selected, the list shows only rows with the state Raised.
- After you clear Raised only and widen the time window, rows with the state Clear appear. This shows that KONA Core cleared those alarms when their condition ended.
- After you fix a cause, clear Raised only and select Refresh. A new Clear record appears in the history. confirm the typical delay between the fix and the Clear record.
Troubleshooting
| Symptom | Likely cause | What to do |
|---|---|---|
| Alarms isn't in the side menu. | You use a System role, which has no Alarms page. | Ask the administrator of the Provider or Customer responsible for the entity to check its alarms. |
| The list is empty, but you expect alarms. | The filters, Raised only or the time window hide them. | Clear all filters, clear Raised only and set Last to 30 days. |
| An alarm stays Raised after you fixed the cause. | The condition isn't over yet for KONA Core, for example the device hasn't sent an uplink since the fix. | Wait for the next uplink or report, then select Refresh. Check Description details for a second cause. |
Still stuck? A Customer contacts their Provider, and a Provider contacts TEKTELIC Support. Send the event name, the GW-ID, DevEUI or integration name, the Start time in UTC, the description details and a screenshot of the Alarms page.
Related
- Events & Alarms
- Alarm Notifications
- Alarms & Events Reference
- Configure Application Alarm Rules
- Configure Gateway Group Alarm Rules
- Monitor Gateways
- To read alarms from your own system, use Get raised enhanced events and Get all enhanced events.